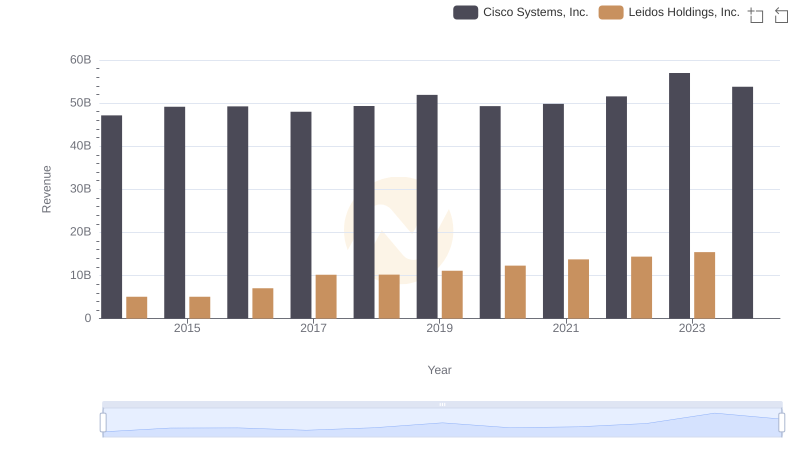
| __timestamp | Cisco Systems, Inc. | Leidos Holdings, Inc. |
|---|---|---|
| Wednesday, January 1, 2014 | 19373000000 | 4392000000 |
| Thursday, January 1, 2015 | 19480000000 | 4468000000 |
| Friday, January 1, 2016 | 18287000000 | 6191000000 |
| Sunday, January 1, 2017 | 17781000000 | 8923000000 |
| Monday, January 1, 2018 | 18724000000 | 8690000000 |
| Tuesday, January 1, 2019 | 19238000000 | 9546000000 |
| Wednesday, January 1, 2020 | 17618000000 | 10560000000 |
| Friday, January 1, 2021 | 17924000000 | 11723000000 |
| Saturday, January 1, 2022 | 19309000000 | 12312000000 |
| Sunday, January 1, 2023 | 21245000000 | 13194000000 |
| Monday, January 1, 2024 | 18975000000 | 13864000000 |
Infusing magic into the data realm
In the ever-evolving landscape of technology and defense, Cisco Systems, Inc. and Leidos Holdings, Inc. stand as titans in their respective fields. Over the past decade, from 2014 to 2023, these companies have showcased intriguing trends in their cost of revenue, a critical metric reflecting the direct costs attributable to the production of goods sold by a company.
Cisco Systems, Inc. has maintained a relatively stable cost of revenue, with a slight dip in 2020, likely due to global economic shifts. By 2023, Cisco's cost of revenue surged by approximately 10% compared to 2014, indicating robust growth and adaptation.
Conversely, Leidos Holdings, Inc. exhibited a more dynamic trajectory, with a remarkable 200% increase in cost of revenue from 2014 to 2023. This surge underscores Leidos' aggressive expansion and increased operational scale in the defense sector.
Notably, data for 2024 is incomplete, highlighting the need for ongoing analysis to capture future trends.
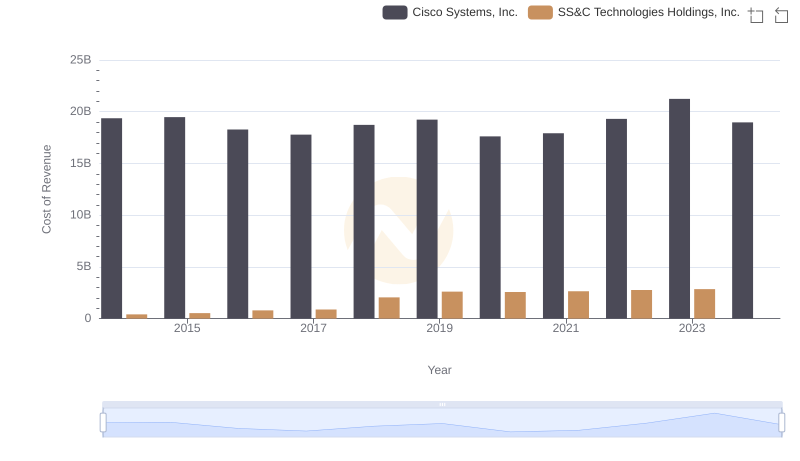
Cisco Systems, Inc. vs SS&C Technologies Holdings, Inc.: Efficiency in Cost of Revenue Explored
Comparing Revenue Performance: Cisco Systems, Inc. or Leidos Holdings, Inc.?
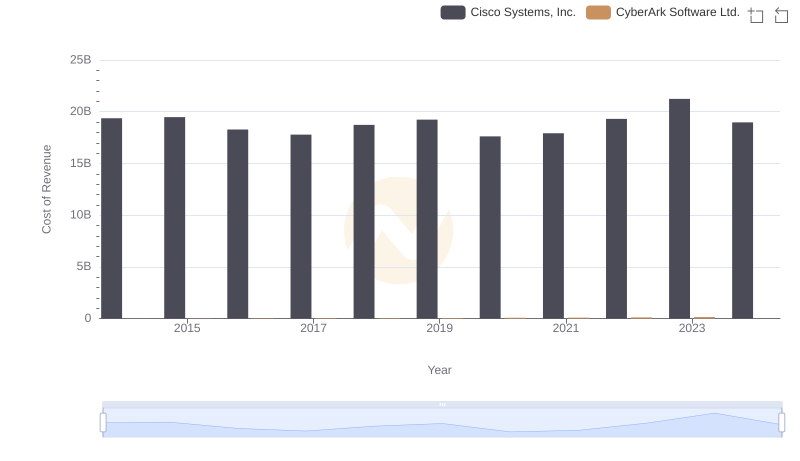
Cisco Systems, Inc. vs CyberArk Software Ltd.: Efficiency in Cost of Revenue Explored
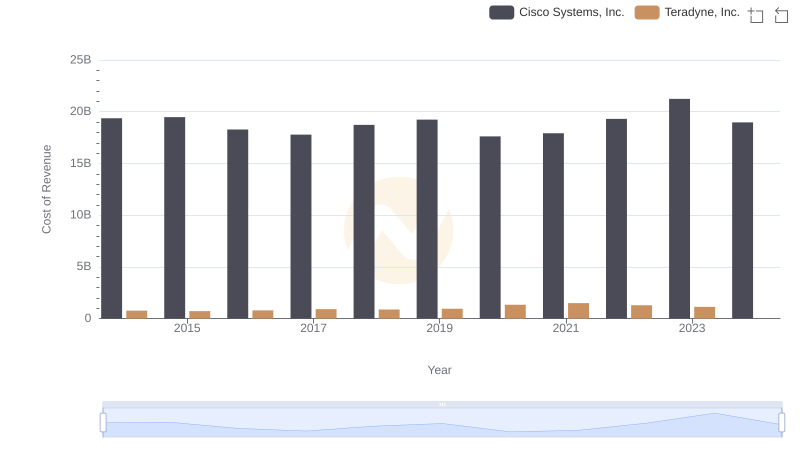
Cost of Revenue Comparison: Cisco Systems, Inc. vs Teradyne, Inc.
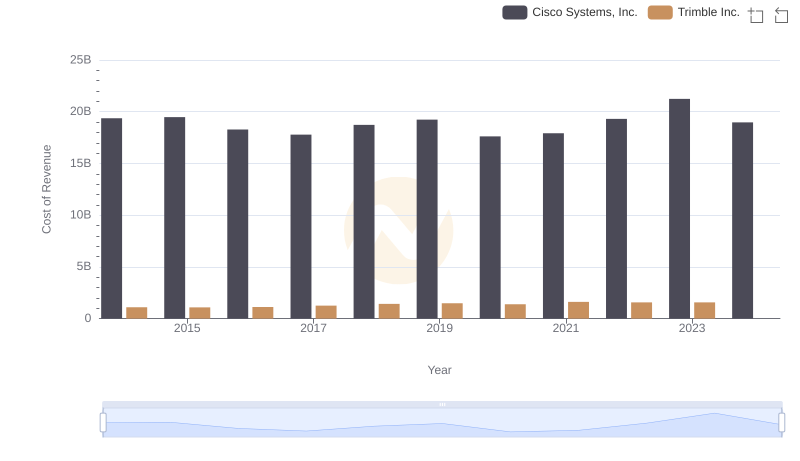
Cost Insights: Breaking Down Cisco Systems, Inc. and Trimble Inc.'s Expenses
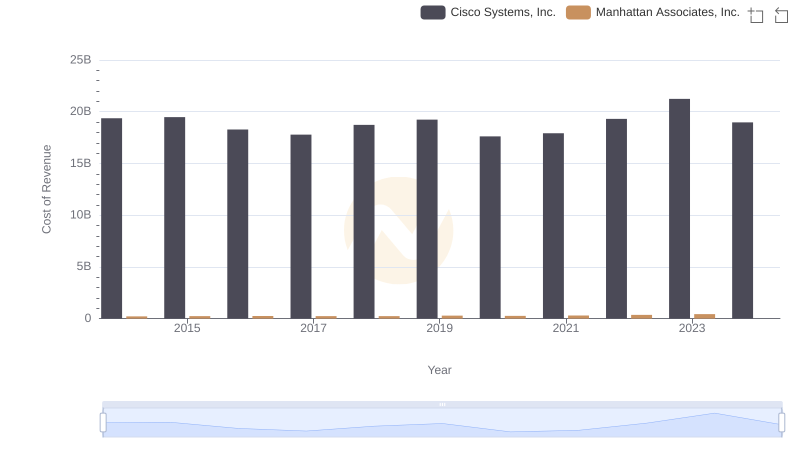
Cisco Systems, Inc. vs Manhattan Associates, Inc.: Efficiency in Cost of Revenue Explored

Gross Profit Analysis: Comparing Cisco Systems, Inc. and Leidos Holdings, Inc.
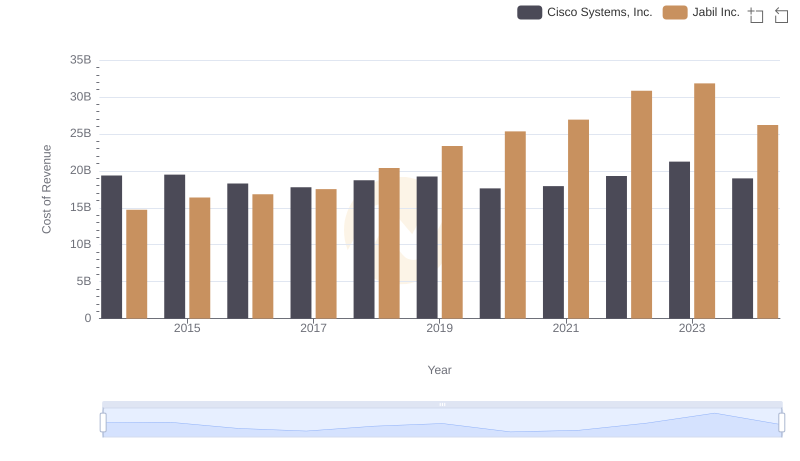
Analyzing Cost of Revenue: Cisco Systems, Inc. and Jabil Inc.
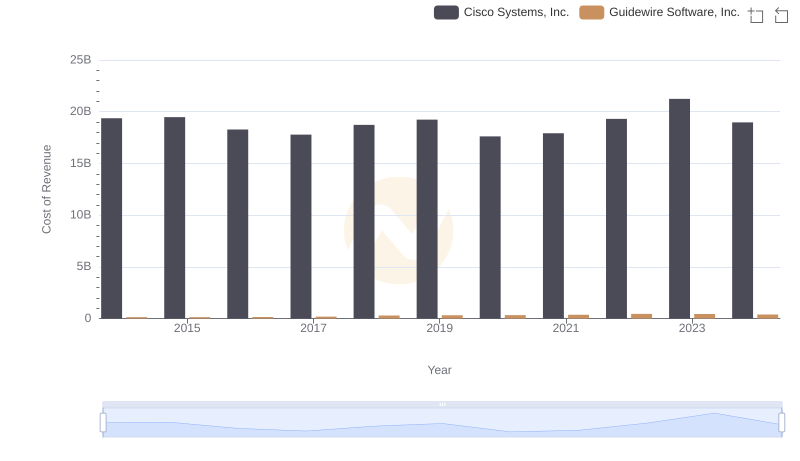
Cost of Revenue Trends: Cisco Systems, Inc. vs Guidewire Software, Inc.
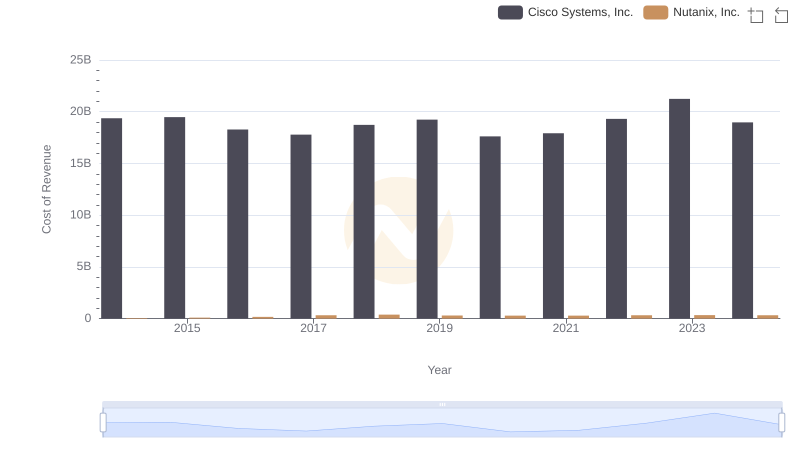
Cost Insights: Breaking Down Cisco Systems, Inc. and Nutanix, Inc.'s Expenses
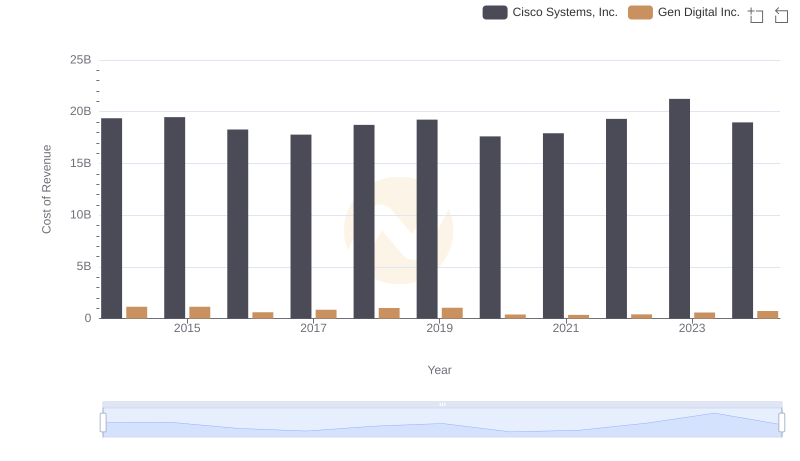
Comparing Cost of Revenue Efficiency: Cisco Systems, Inc. vs Gen Digital Inc.
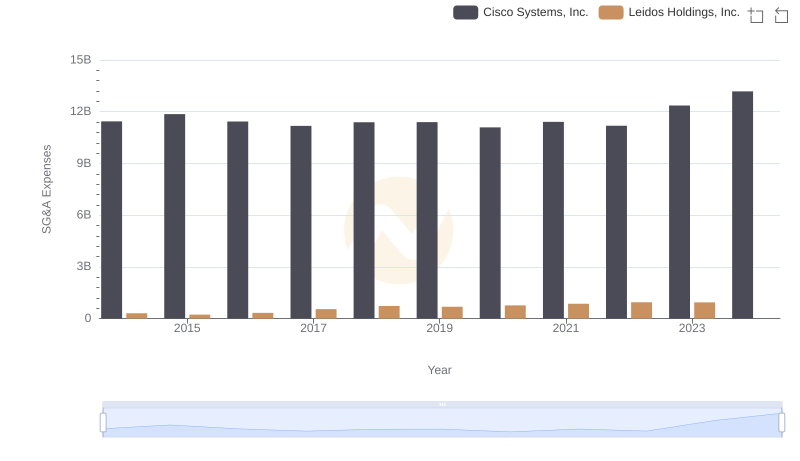
Operational Costs Compared: SG&A Analysis of Cisco Systems, Inc. and Leidos Holdings, Inc.