| __timestamp | Cisco Systems, Inc. | KLA Corporation |
|---|---|---|
| Wednesday, January 1, 2014 | 12709000000 | 855142000 |
| Thursday, January 1, 2015 | 14209000000 | 773476000 |
| Friday, January 1, 2016 | 15678000000 | 1036277000 |
| Sunday, January 1, 2017 | 15383000000 | 1276261000 |
| Monday, January 1, 2018 | 16172000000 | 1599878000 |
| Tuesday, January 1, 2019 | 17334000000 | 1620873000 |
| Wednesday, January 1, 2020 | 16363000000 | 2104221000 |
| Friday, January 1, 2021 | 15558000000 | 2851117000 |
| Saturday, January 1, 2022 | 16794000000 | 4012920000 |
| Sunday, January 1, 2023 | 17471000000 | 4406901000 |
| Monday, January 1, 2024 | 15747000000 | 3906779000 |
Infusing magic into the data realm
In the ever-evolving tech industry, Cisco Systems, Inc. and KLA Corporation have showcased remarkable financial trajectories over the past decade. Cisco, a stalwart in networking, consistently outperformed KLA, a leader in semiconductor equipment, in terms of EBITDA. From 2014 to 2023, Cisco's EBITDA grew by approximately 37%, peaking in 2023, while KLA's EBITDA surged by over 400%, reflecting its dynamic growth strategy.
This financial analysis underscores the contrasting strategies of these tech giants, with Cisco focusing on stability and KLA on rapid growth, offering valuable insights for investors and industry analysts alike.
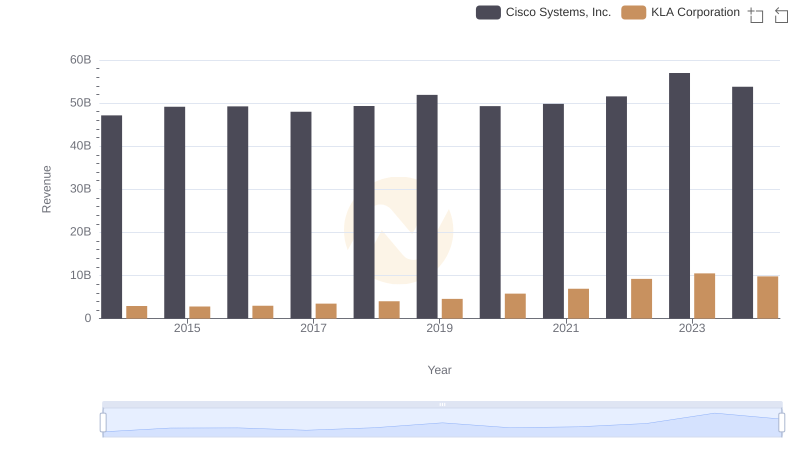
Cisco Systems, Inc. vs KLA Corporation: Annual Revenue Growth Compared
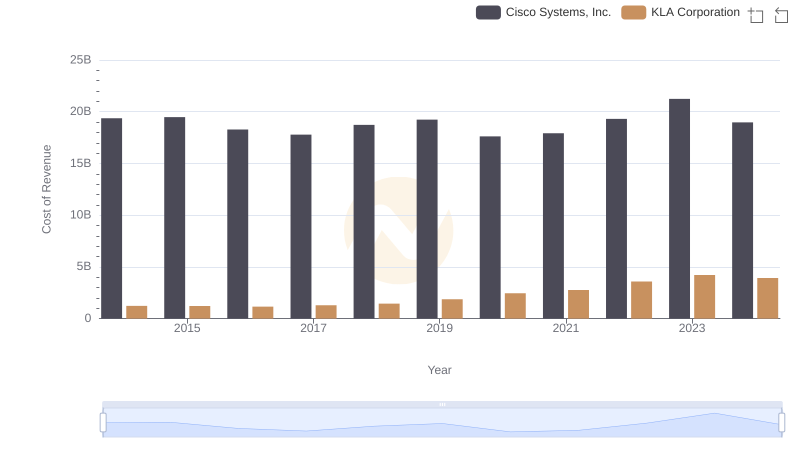
Cisco Systems, Inc. vs KLA Corporation: Efficiency in Cost of Revenue Explored
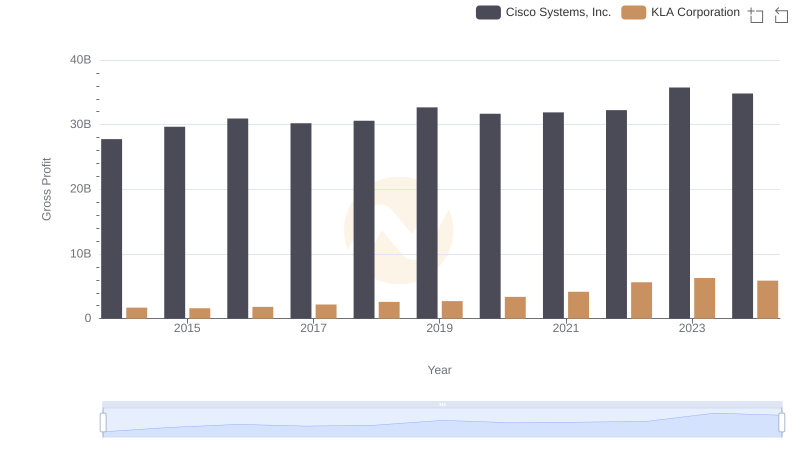
Gross Profit Comparison: Cisco Systems, Inc. and KLA Corporation Trends
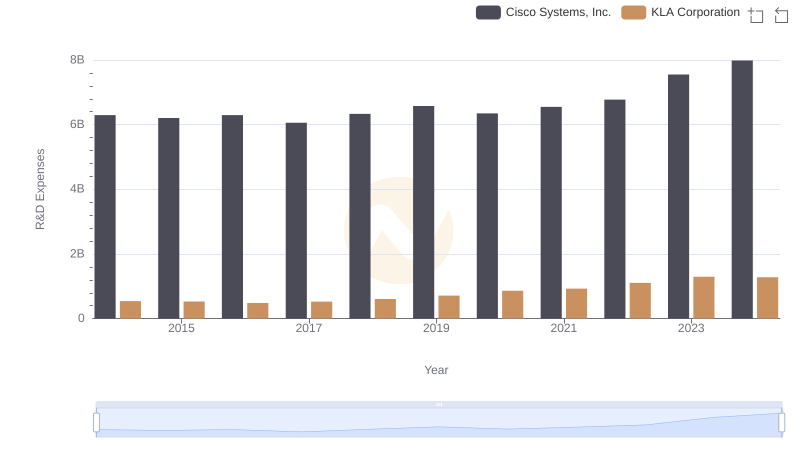
R&D Insights: How Cisco Systems, Inc. and KLA Corporation Allocate Funds
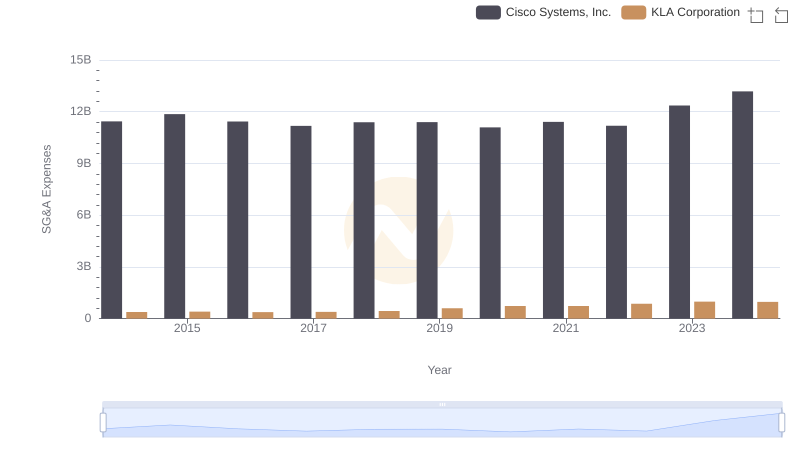
Who Optimizes SG&A Costs Better? Cisco Systems, Inc. or KLA Corporation
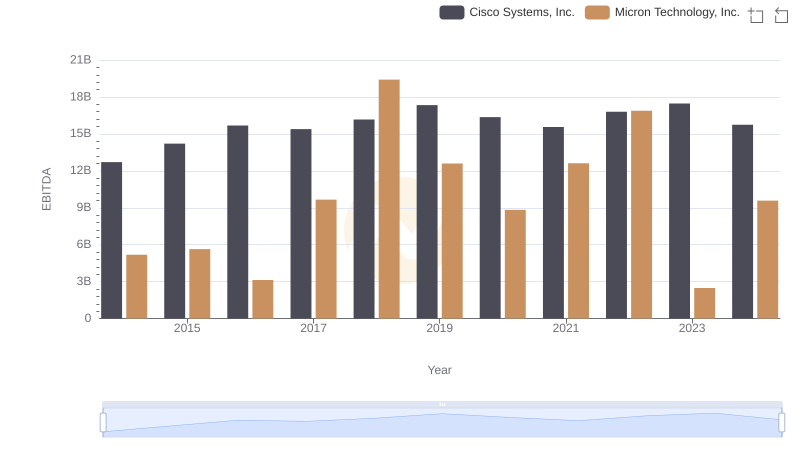
A Side-by-Side Analysis of EBITDA: Cisco Systems, Inc. and Micron Technology, Inc.
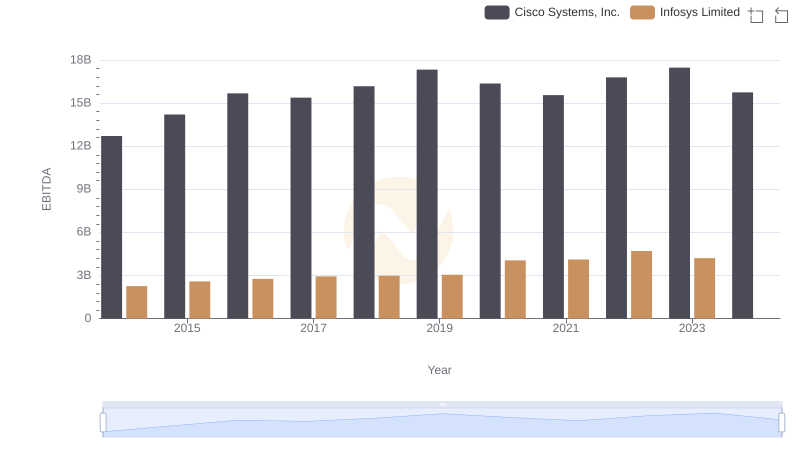
Professional EBITDA Benchmarking: Cisco Systems, Inc. vs Infosys Limited
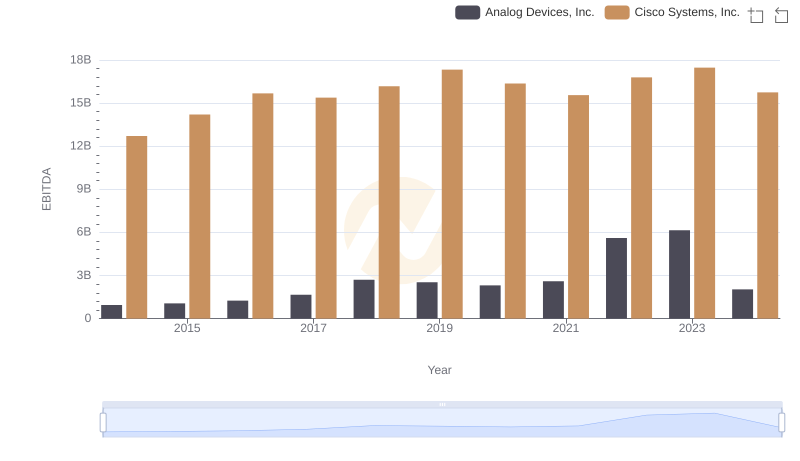
Cisco Systems, Inc. vs Analog Devices, Inc.: In-Depth EBITDA Performance Comparison
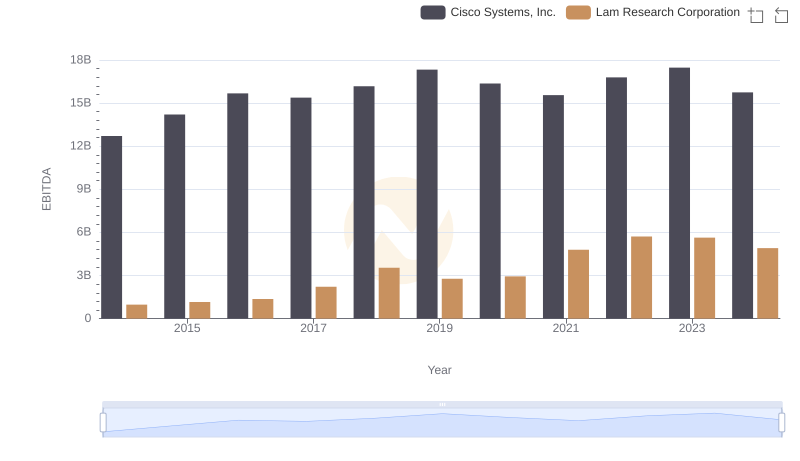
Professional EBITDA Benchmarking: Cisco Systems, Inc. vs Lam Research Corporation
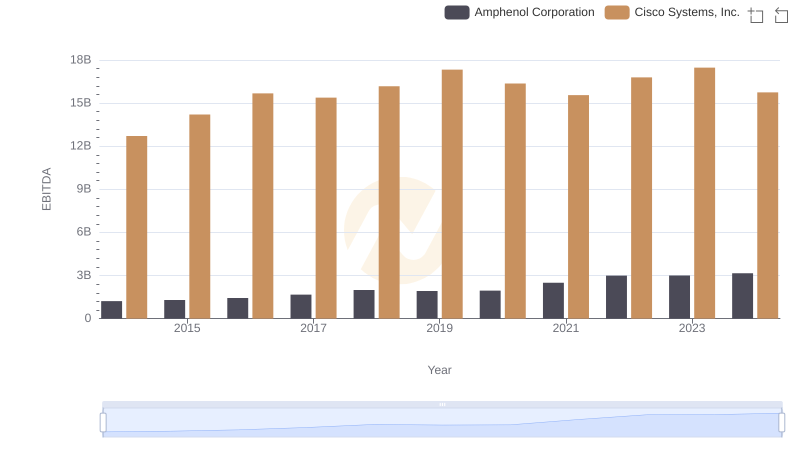
Comprehensive EBITDA Comparison: Cisco Systems, Inc. vs Amphenol Corporation
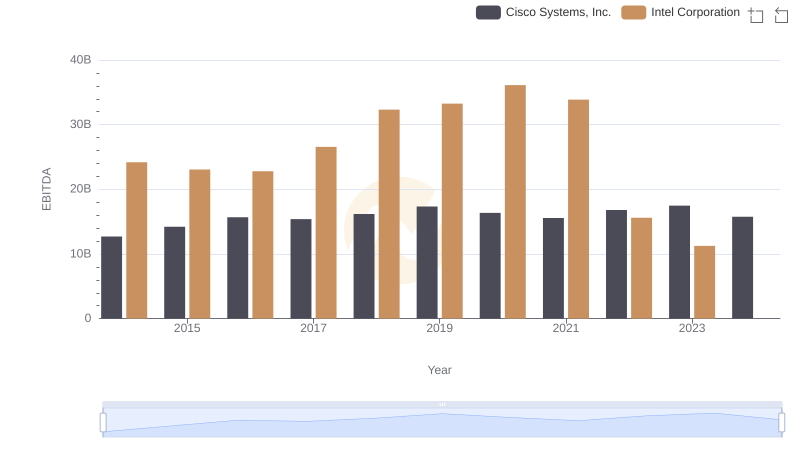
EBITDA Metrics Evaluated: Cisco Systems, Inc. vs Intel Corporation
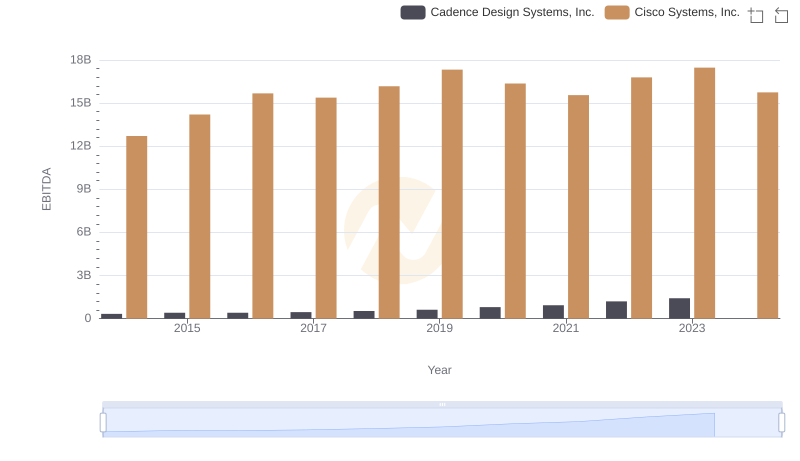
Professional EBITDA Benchmarking: Cisco Systems, Inc. vs Cadence Design Systems, Inc.