| __timestamp | Cisco Systems, Inc. | CyberArk Software Ltd. |
|---|---|---|
| Wednesday, January 1, 2014 | 11437000000 | 53438000 |
| Thursday, January 1, 2015 | 11861000000 | 83196000 |
| Friday, January 1, 2016 | 11433000000 | 115892000 |
| Sunday, January 1, 2017 | 11177000000 | 157138000 |
| Monday, January 1, 2018 | 11386000000 | 190334000 |
| Tuesday, January 1, 2019 | 11398000000 | 236476000 |
| Wednesday, January 1, 2020 | 11094000000 | 280428000 |
| Friday, January 1, 2021 | 11411000000 | 345826000 |
| Saturday, January 1, 2022 | 11186000000 | 427793000 |
| Sunday, January 1, 2023 | 12358000000 | 500784000 |
| Monday, January 1, 2024 | 13177000000 | 593210000 |
Unleashing the power of data
In the ever-evolving tech landscape, understanding operational efficiency is crucial. Cisco Systems, Inc. and CyberArk Software Ltd. offer a fascinating study in contrasts. From 2014 to 2023, Cisco's Selling, General, and Administrative (SG&A) expenses have shown a steady increase, peaking at approximately $13.2 billion in 2023. This represents a 15% rise from 2014, reflecting Cisco's expansive operational strategies.
Conversely, CyberArk's SG&A expenses have surged by over 800% during the same period, reaching around $500 million in 2023. This dramatic increase underscores CyberArk's aggressive growth and market penetration efforts. However, data for 2024 is missing, leaving room for speculation on future trends.
This analysis highlights the diverse strategies of established giants and emerging players in the tech industry, offering valuable insights into their operational efficiencies.
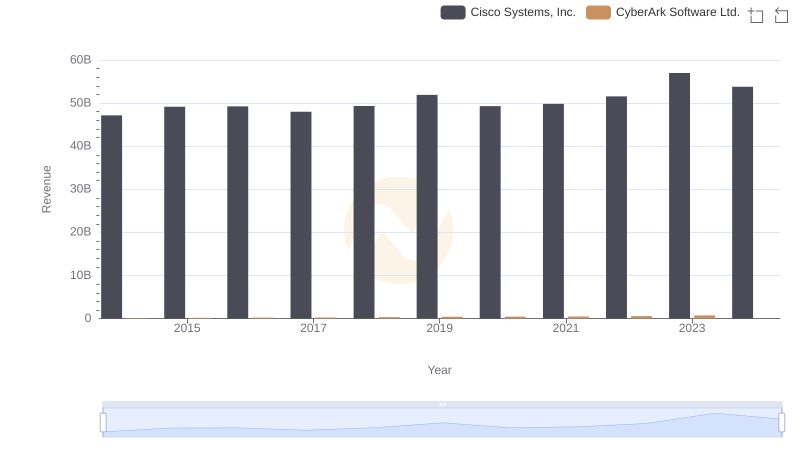
Cisco Systems, Inc. and CyberArk Software Ltd.: A Comprehensive Revenue Analysis
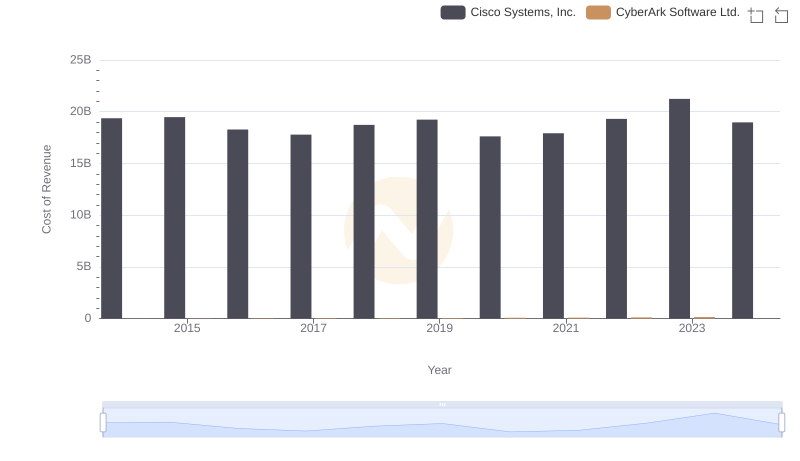
Cisco Systems, Inc. vs CyberArk Software Ltd.: Efficiency in Cost of Revenue Explored
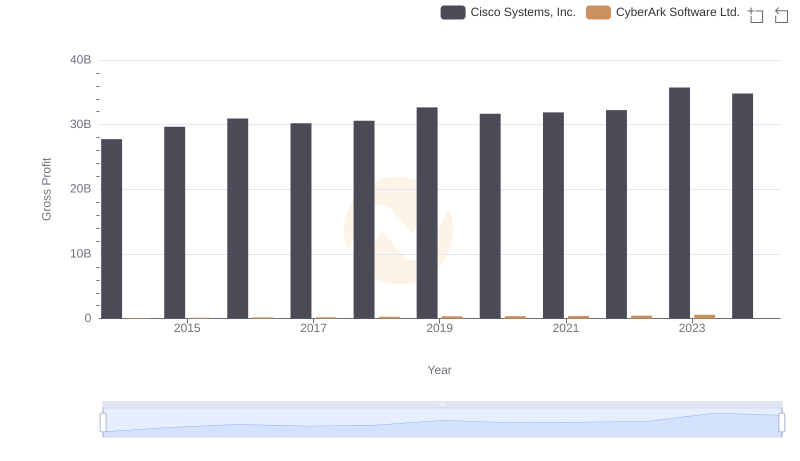
Gross Profit Analysis: Comparing Cisco Systems, Inc. and CyberArk Software Ltd.
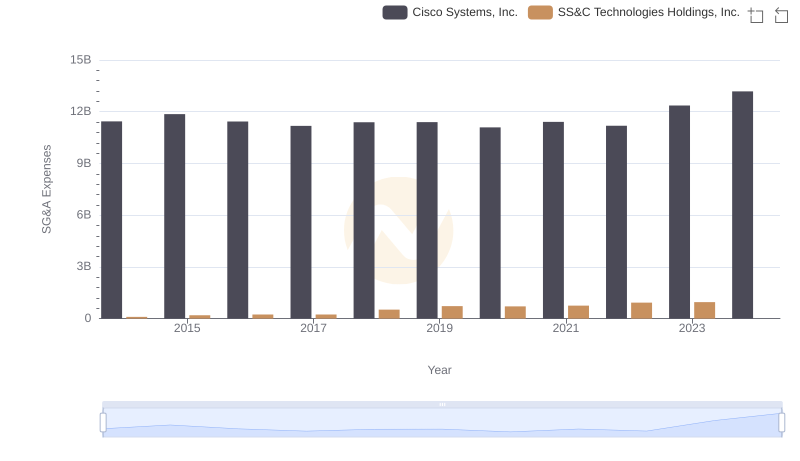
Cisco Systems, Inc. and SS&C Technologies Holdings, Inc.: SG&A Spending Patterns Compared
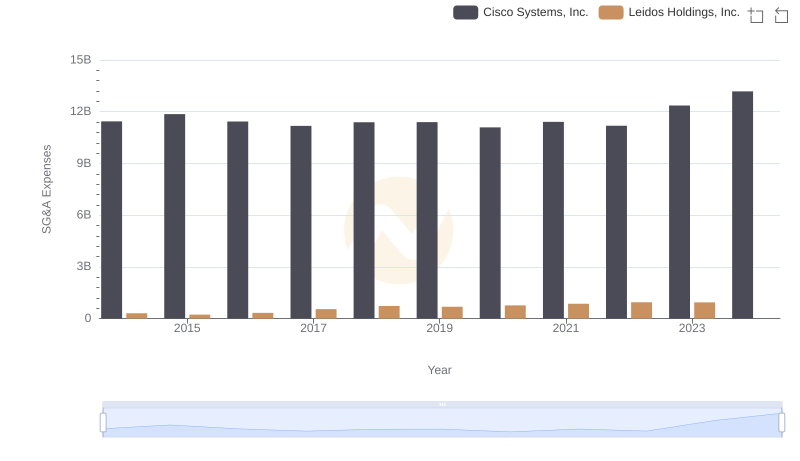
Operational Costs Compared: SG&A Analysis of Cisco Systems, Inc. and Leidos Holdings, Inc.

Research and Development Expenses Breakdown: Cisco Systems, Inc. vs CyberArk Software Ltd.
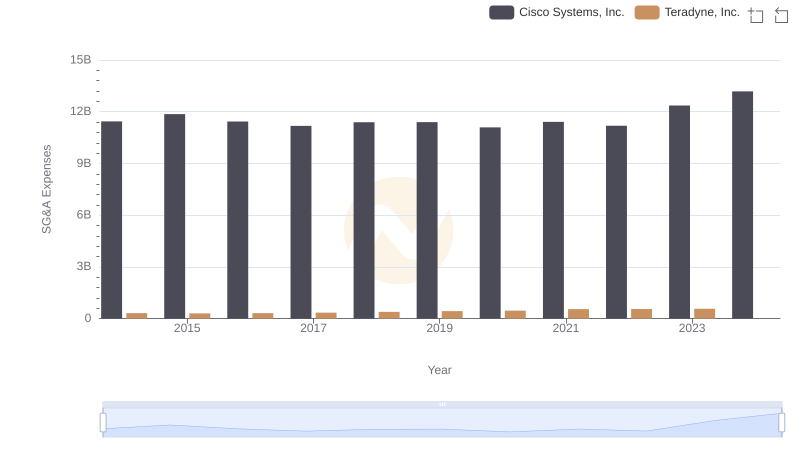
Cisco Systems, Inc. or Teradyne, Inc.: Who Manages SG&A Costs Better?
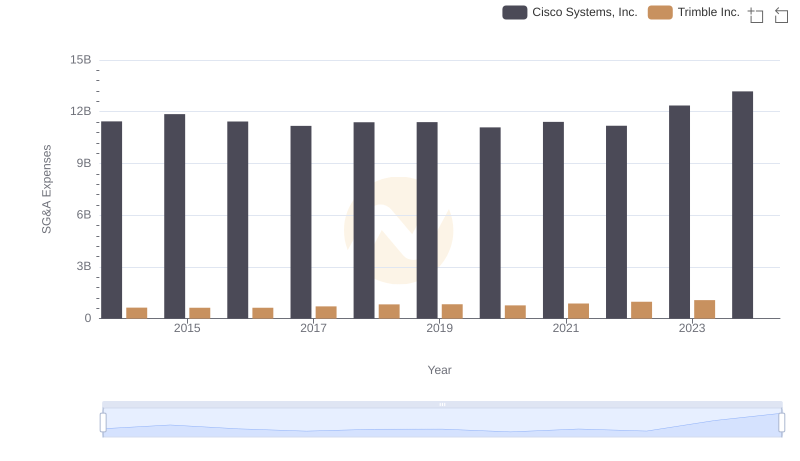
Cost Management Insights: SG&A Expenses for Cisco Systems, Inc. and Trimble Inc.
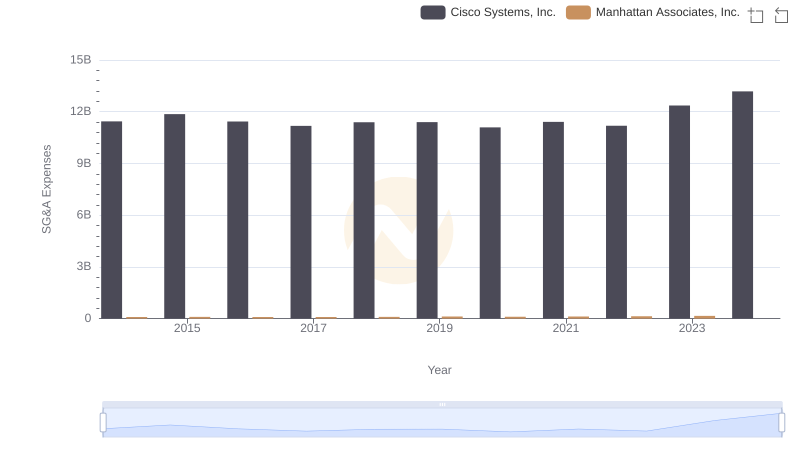
Who Optimizes SG&A Costs Better? Cisco Systems, Inc. or Manhattan Associates, Inc.
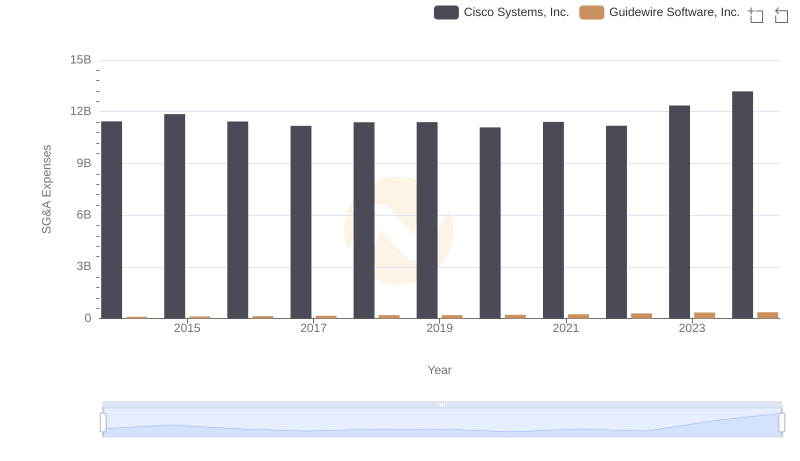
Cisco Systems, Inc. vs Guidewire Software, Inc.: SG&A Expense Trends
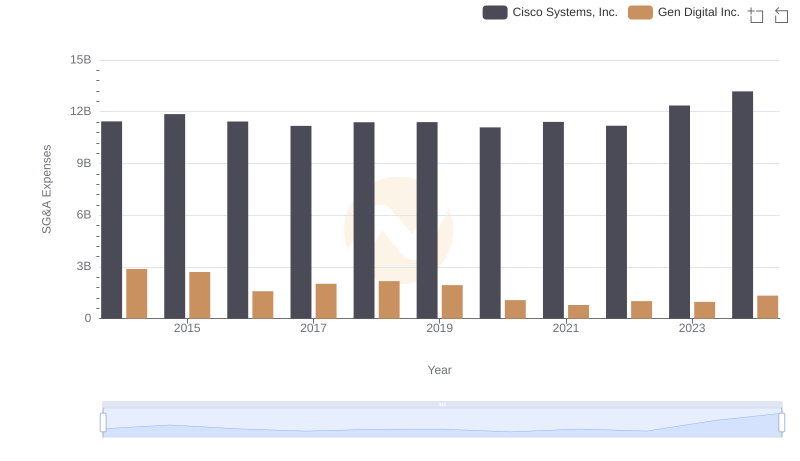
SG&A Efficiency Analysis: Comparing Cisco Systems, Inc. and Gen Digital Inc.
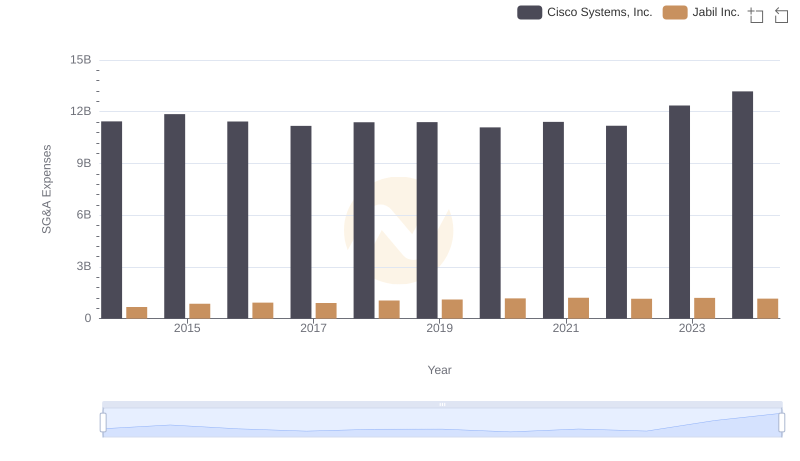
SG&A Efficiency Analysis: Comparing Cisco Systems, Inc. and Jabil Inc.