| __timestamp | Expeditors International of Washington, Inc. | Waste Connections, Inc. |
|---|---|---|
| Wednesday, January 1, 2014 | 5800725000 | 1138388000 |
| Thursday, January 1, 2015 | 5720848000 | 1177409000 |
| Friday, January 1, 2016 | 5247244000 | 1957712000 |
| Sunday, January 1, 2017 | 6037921000 | 2704775000 |
| Monday, January 1, 2018 | 7118083000 | 2865704000 |
| Tuesday, January 1, 2019 | 7178405000 | 3198757000 |
| Wednesday, January 1, 2020 | 8953716000 | 3276808000 |
| Friday, January 1, 2021 | 14358105000 | 3654074000 |
| Saturday, January 1, 2022 | 14900154000 | 4336012000 |
| Sunday, January 1, 2023 | 8054634000 | 4744513000 |
| Monday, January 1, 2024 | 0 | 5191706000 |
Igniting the spark of knowledge
In the ever-evolving landscape of corporate finance, understanding the cost of revenue is crucial for assessing a company's operational efficiency. This analysis delves into the cost of revenue trends for Waste Connections, Inc. and Expeditors International of Washington, Inc. from 2014 to 2023. Over this period, Expeditors International experienced a significant surge, peaking in 2022 with a 185% increase from its 2014 figures. However, 2023 saw a notable decline of 46%, reflecting potential market adjustments or strategic shifts. Conversely, Waste Connections demonstrated a steady upward trajectory, with a 317% rise over the same period, indicating robust growth and operational scaling. These trends highlight the dynamic nature of cost management in different sectors, offering valuable insights for investors and industry analysts alike. As companies navigate economic fluctuations, understanding these patterns becomes essential for strategic decision-making.
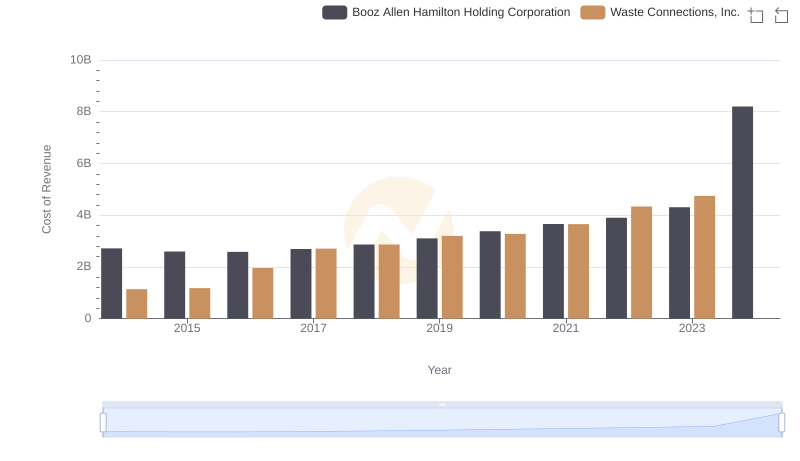
Cost Insights: Breaking Down Waste Connections, Inc. and Booz Allen Hamilton Holding Corporation's Expenses
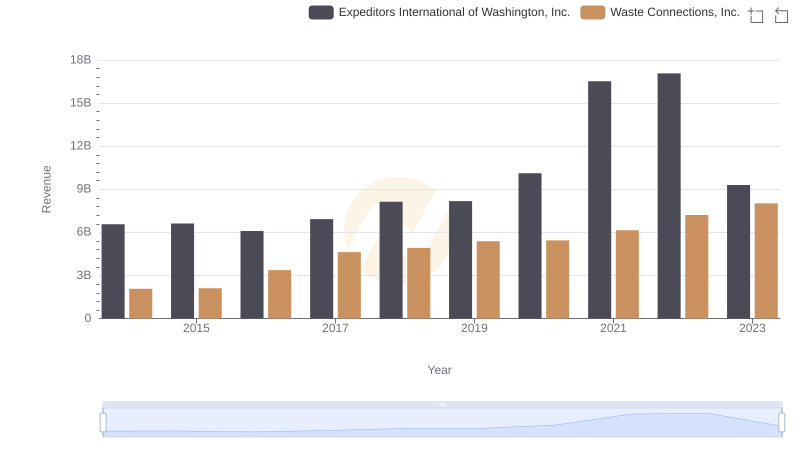
Waste Connections, Inc. or Expeditors International of Washington, Inc.: Who Leads in Yearly Revenue?
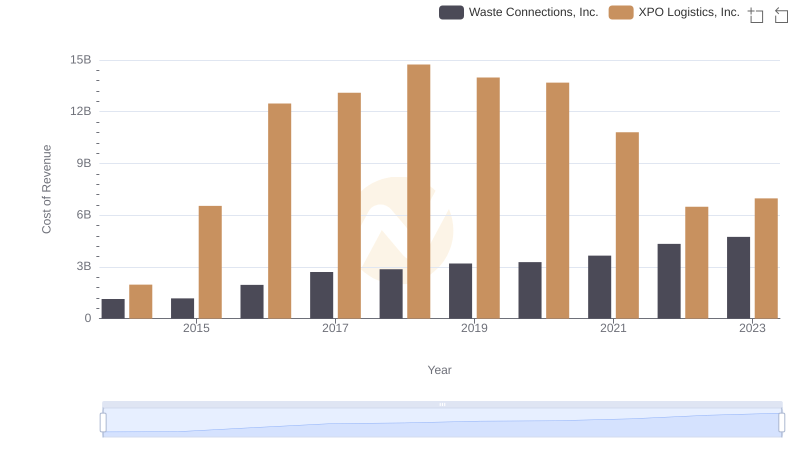
Comparing Cost of Revenue Efficiency: Waste Connections, Inc. vs XPO Logistics, Inc.
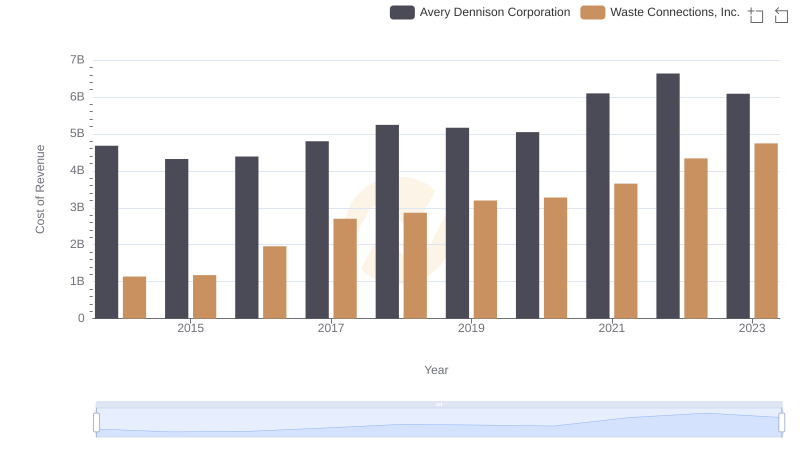
Cost Insights: Breaking Down Waste Connections, Inc. and Avery Dennison Corporation's Expenses
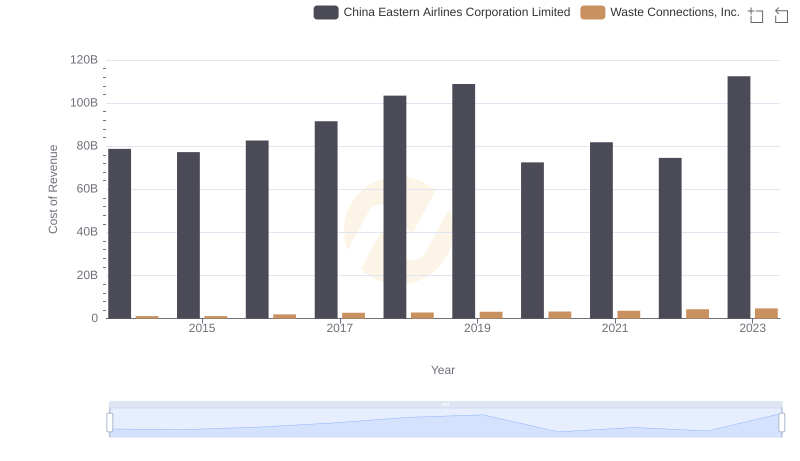
Comparing Cost of Revenue Efficiency: Waste Connections, Inc. vs China Eastern Airlines Corporation Limited
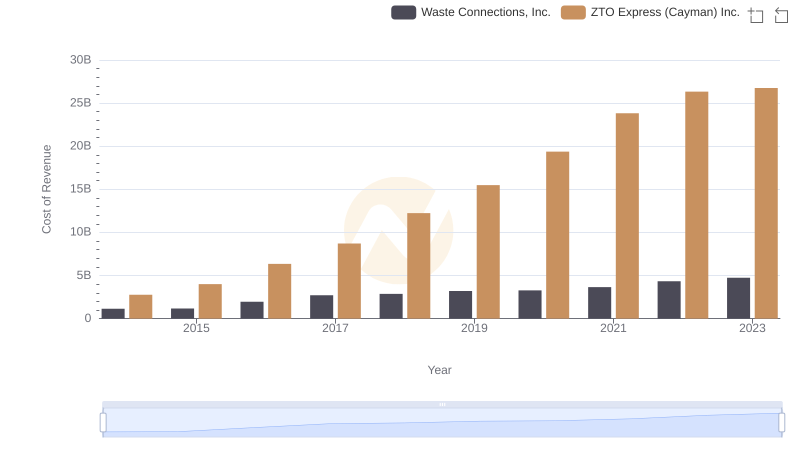
Cost Insights: Breaking Down Waste Connections, Inc. and ZTO Express (Cayman) Inc.'s Expenses
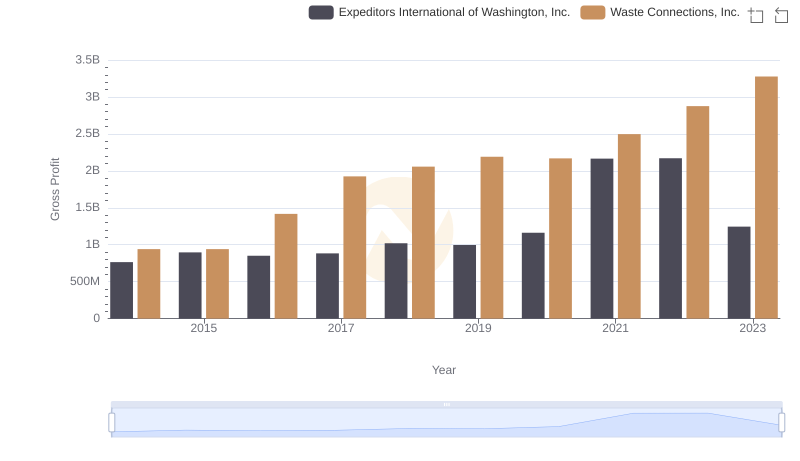
Gross Profit Trends Compared: Waste Connections, Inc. vs Expeditors International of Washington, Inc.
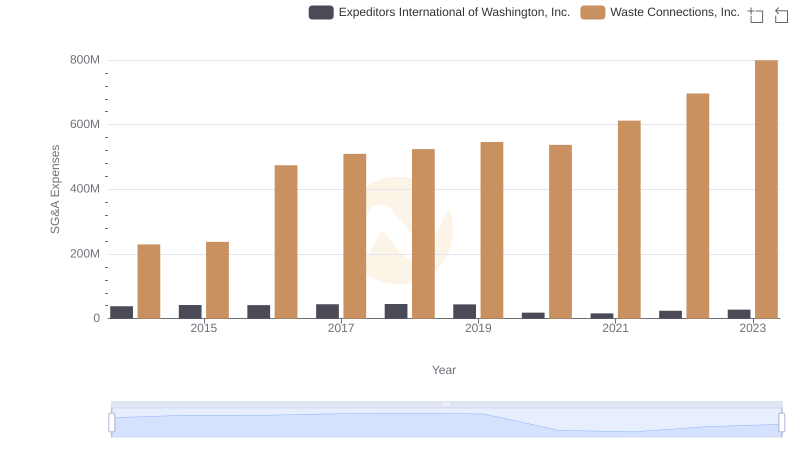
Breaking Down SG&A Expenses: Waste Connections, Inc. vs Expeditors International of Washington, Inc.
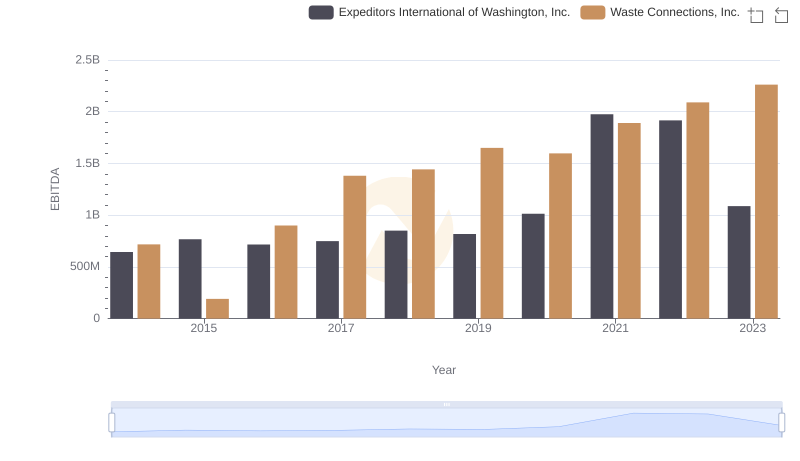
A Side-by-Side Analysis of EBITDA: Waste Connections, Inc. and Expeditors International of Washington, Inc.