| __timestamp | Waste Connections, Inc. | XPO Logistics, Inc. |
|---|---|---|
| Wednesday, January 1, 2014 | 229474000 | 422500000 |
| Thursday, January 1, 2015 | 237484000 | 1113400000 |
| Friday, January 1, 2016 | 474263000 | 1651200000 |
| Sunday, January 1, 2017 | 509638000 | 1656500000 |
| Monday, January 1, 2018 | 524388000 | 1837000000 |
| Tuesday, January 1, 2019 | 546278000 | 1845000000 |
| Wednesday, January 1, 2020 | 537632000 | 2172000000 |
| Friday, January 1, 2021 | 612337000 | 1322000000 |
| Saturday, January 1, 2022 | 696467000 | 678000000 |
| Sunday, January 1, 2023 | 799119000 | 167000000 |
| Monday, January 1, 2024 | 883445000 | 134000000 |
Igniting the spark of knowledge
In the ever-evolving landscape of corporate finance, understanding the nuances of Selling, General, and Administrative (SG&A) expenses is crucial. Over the past decade, Waste Connections, Inc. and XPO Logistics, Inc. have showcased contrasting trajectories in their SG&A expenditures. From 2014 to 2023, Waste Connections, Inc. has seen a steady increase, with expenses growing by approximately 248%, peaking in 2023. In contrast, XPO Logistics, Inc. experienced a significant fluctuation, with a peak in 2020, followed by a dramatic decline of nearly 92% by 2023. This divergence highlights the strategic differences in operational management and cost control between the two companies. As businesses navigate the complexities of the modern economy, these insights into SG&A trends offer valuable lessons in financial stewardship and strategic planning.
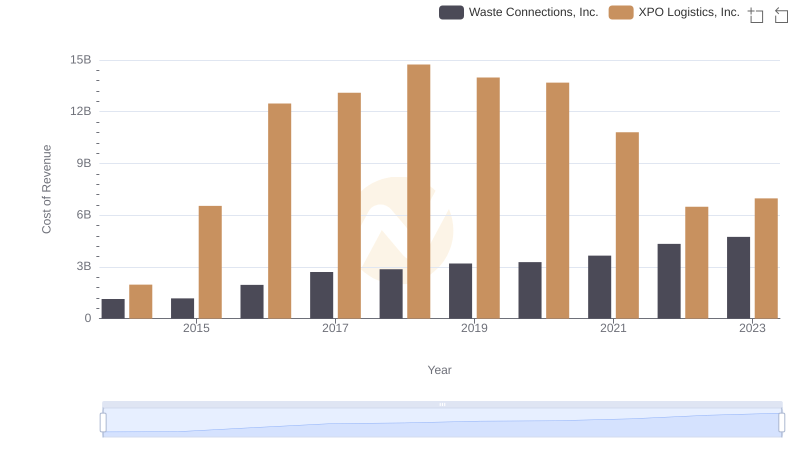
Comparing Cost of Revenue Efficiency: Waste Connections, Inc. vs XPO Logistics, Inc.
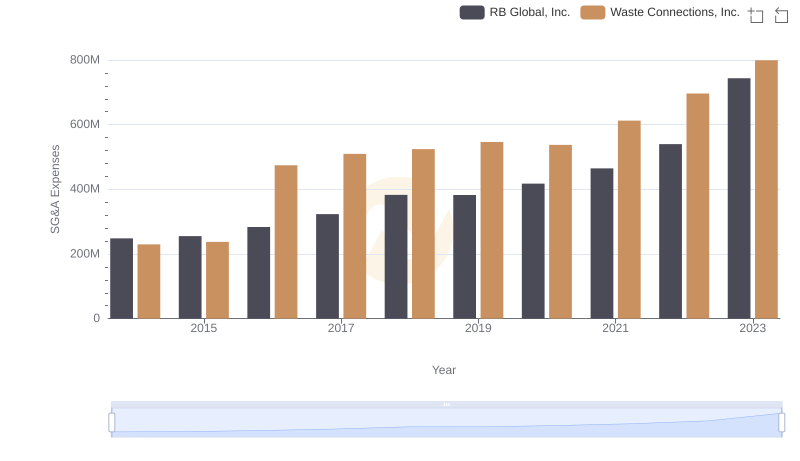
Waste Connections, Inc. vs RB Global, Inc.: SG&A Expense Trends
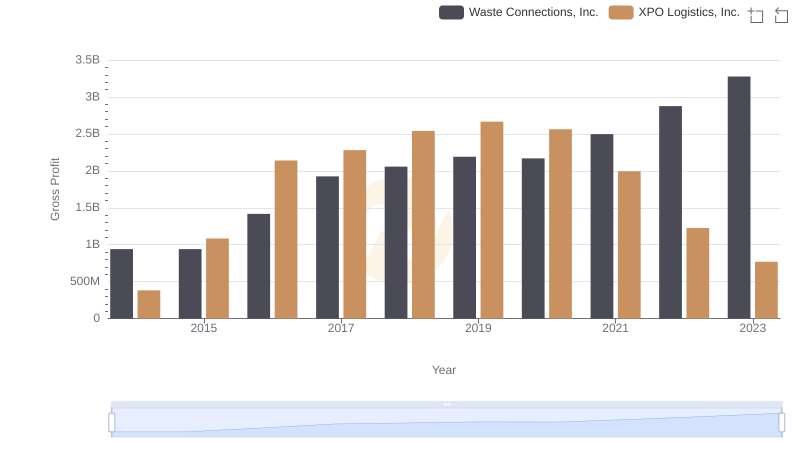
Who Generates Higher Gross Profit? Waste Connections, Inc. or XPO Logistics, Inc.
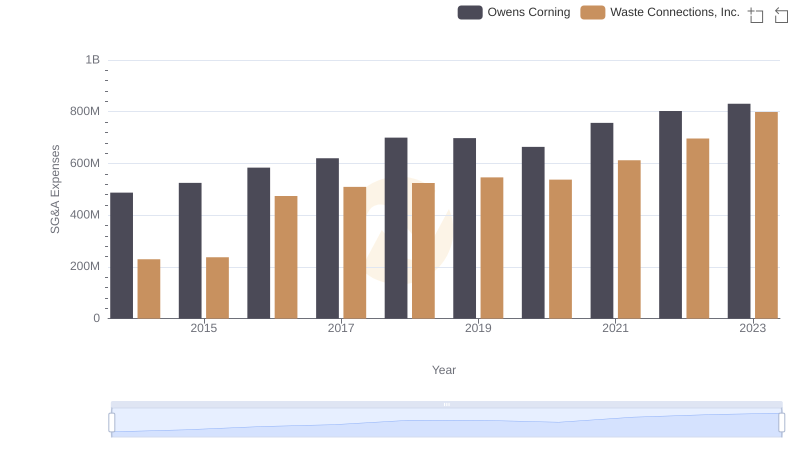
Who Optimizes SG&A Costs Better? Waste Connections, Inc. or Owens Corning

Waste Connections, Inc. and IDEX Corporation: SG&A Spending Patterns Compared
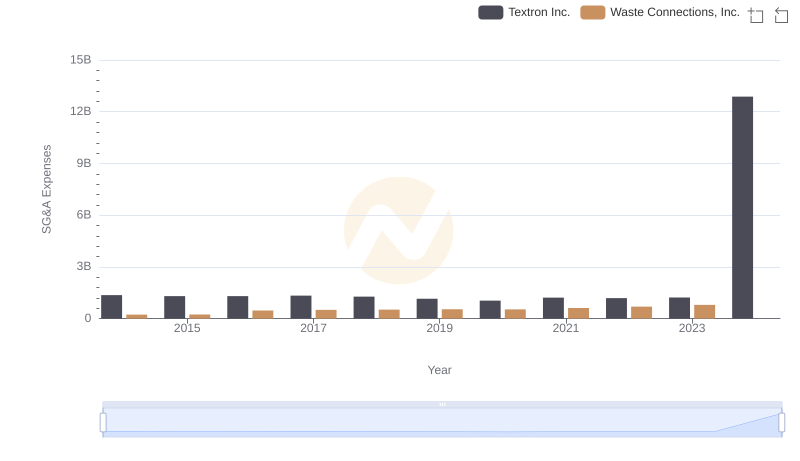
Breaking Down SG&A Expenses: Waste Connections, Inc. vs Textron Inc.
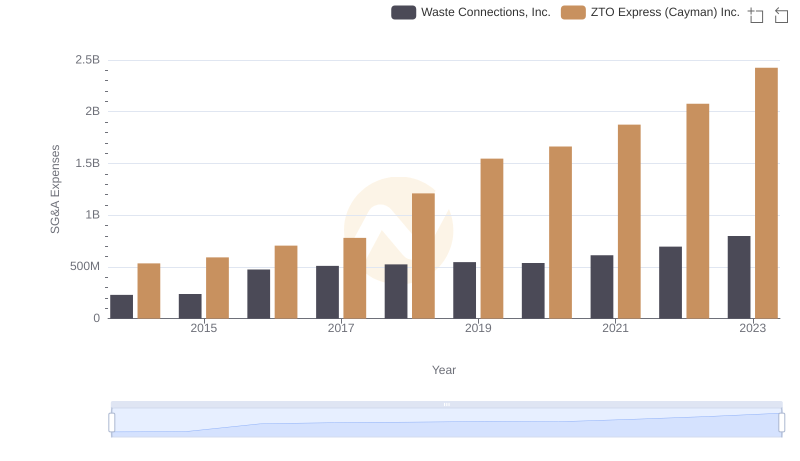
Waste Connections, Inc. vs ZTO Express (Cayman) Inc.: SG&A Expense Trends
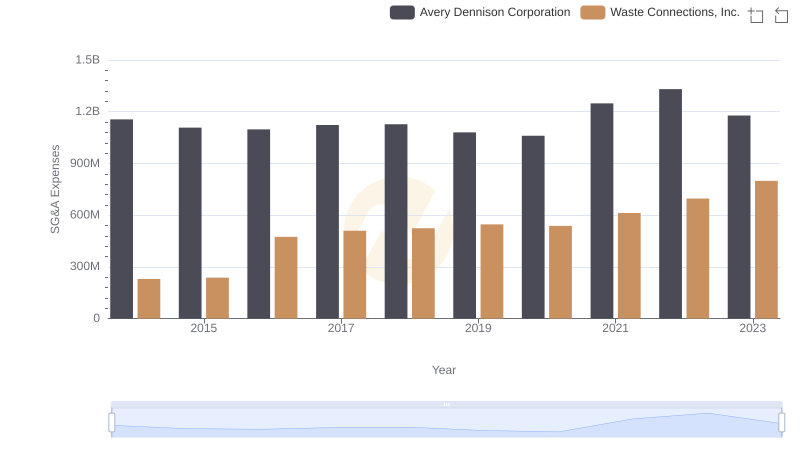
Breaking Down SG&A Expenses: Waste Connections, Inc. vs Avery Dennison Corporation
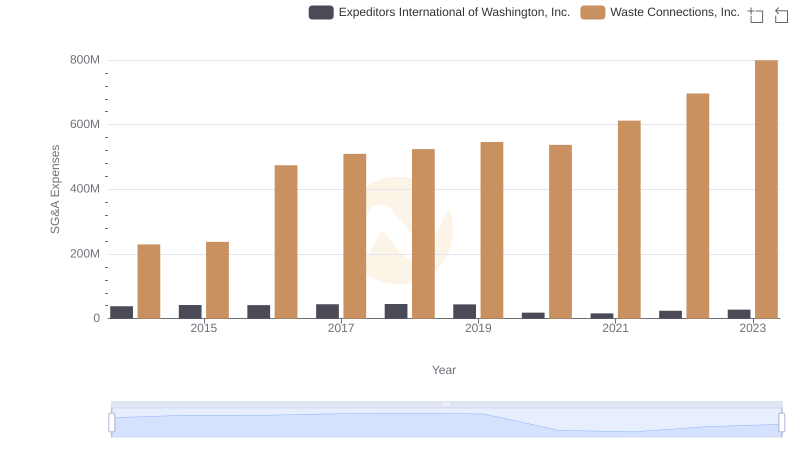
Breaking Down SG&A Expenses: Waste Connections, Inc. vs Expeditors International of Washington, Inc.
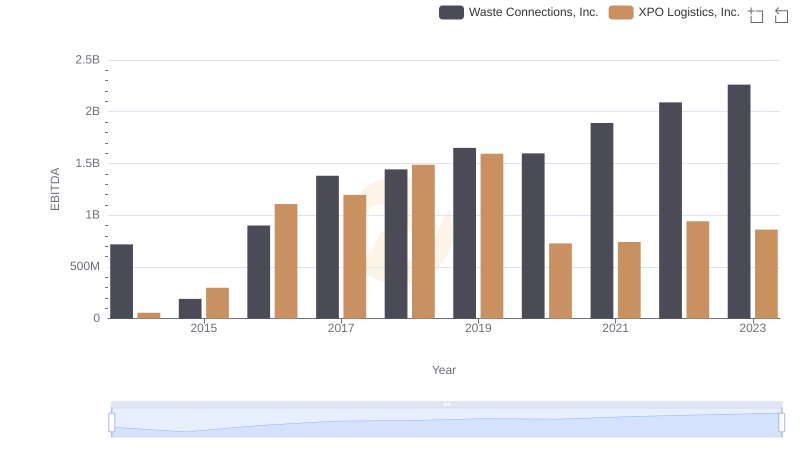
Comprehensive EBITDA Comparison: Waste Connections, Inc. vs XPO Logistics, Inc.