| __timestamp | Comfort Systems USA, Inc. | United Airlines Holdings, Inc. |
|---|---|---|
| Wednesday, January 1, 2014 | 1161024000 | 29569000000 |
| Thursday, January 1, 2015 | 1262390000 | 25952000000 |
| Friday, January 1, 2016 | 1290331000 | 24856000000 |
| Sunday, January 1, 2017 | 1421641000 | 27056000000 |
| Monday, January 1, 2018 | 1736600000 | 30165000000 |
| Tuesday, January 1, 2019 | 2113334000 | 30786000000 |
| Wednesday, January 1, 2020 | 2309676000 | 20385000000 |
| Friday, January 1, 2021 | 2510429000 | 23913000000 |
| Saturday, January 1, 2022 | 3398756000 | 34315000000 |
| Sunday, January 1, 2023 | 4216251000 | 38518000000 |
| Monday, January 1, 2024 | 37643000000 |
Unleashing insights
In the ever-evolving landscape of the airline and construction industries, understanding cost dynamics is crucial. Over the past decade, United Airlines Holdings, Inc. and Comfort Systems USA, Inc. have shown distinct trends in their cost of revenue. United Airlines, a major player in the aviation sector, saw its cost of revenue fluctuate, peaking in 2023 with a 31% increase from its 2020 low. This reflects the industry's recovery post-pandemic. Meanwhile, Comfort Systems USA, a leader in mechanical services, experienced a steady rise, culminating in a 263% increase from 2014 to 2023. This growth underscores the robust demand for construction services. The data highlights the resilience and adaptability of these companies in their respective sectors, offering valuable insights for investors and industry analysts alike.
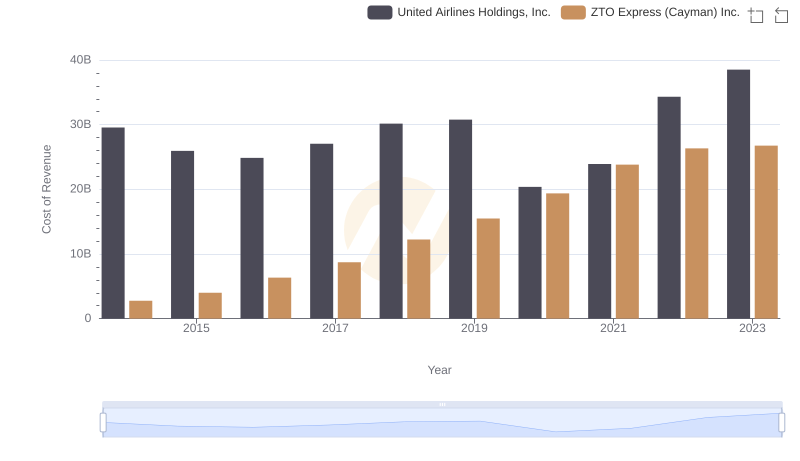
Cost Insights: Breaking Down United Airlines Holdings, Inc. and ZTO Express (Cayman) Inc.'s Expenses
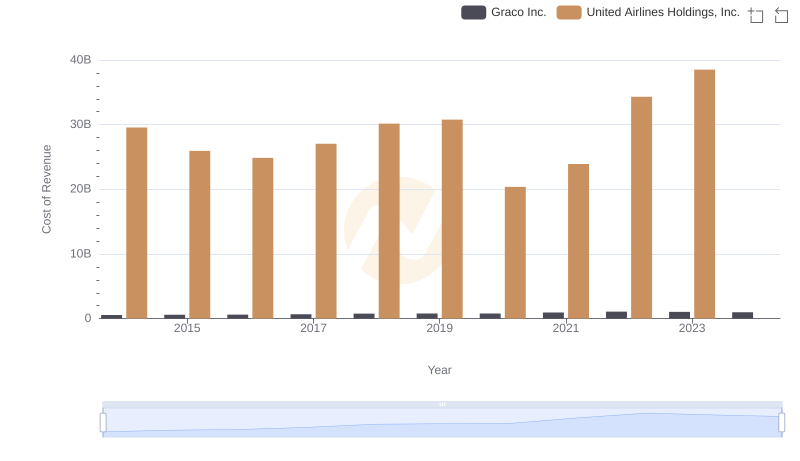
Cost Insights: Breaking Down United Airlines Holdings, Inc. and Graco Inc.'s Expenses
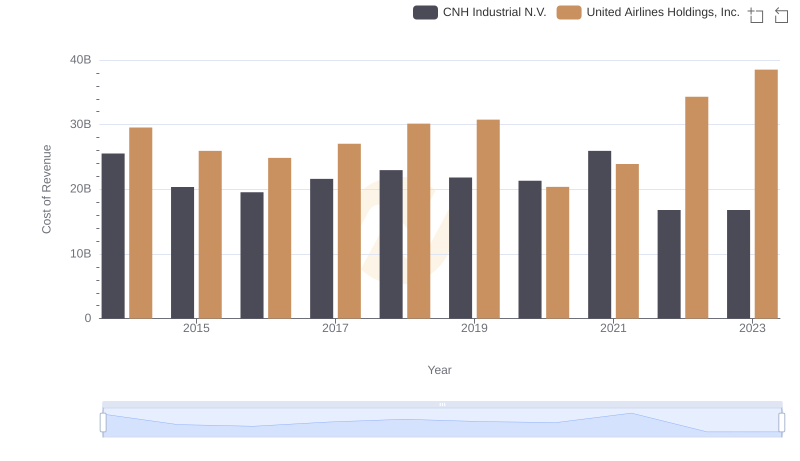
Cost Insights: Breaking Down United Airlines Holdings, Inc. and CNH Industrial N.V.'s Expenses
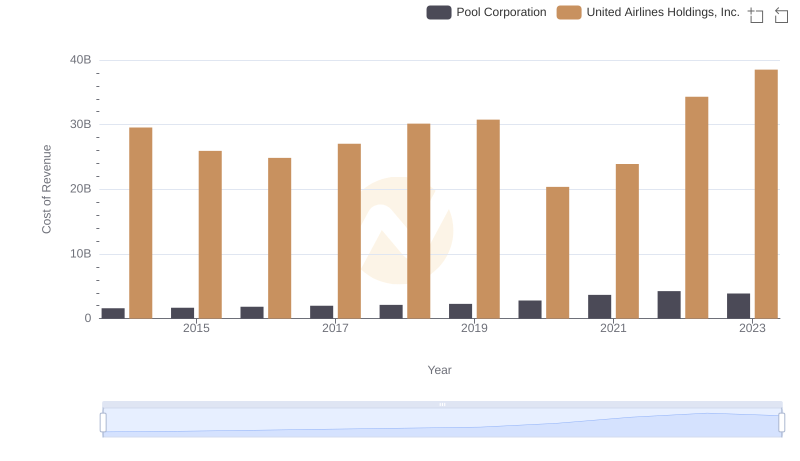
Cost Insights: Breaking Down United Airlines Holdings, Inc. and Pool Corporation's Expenses
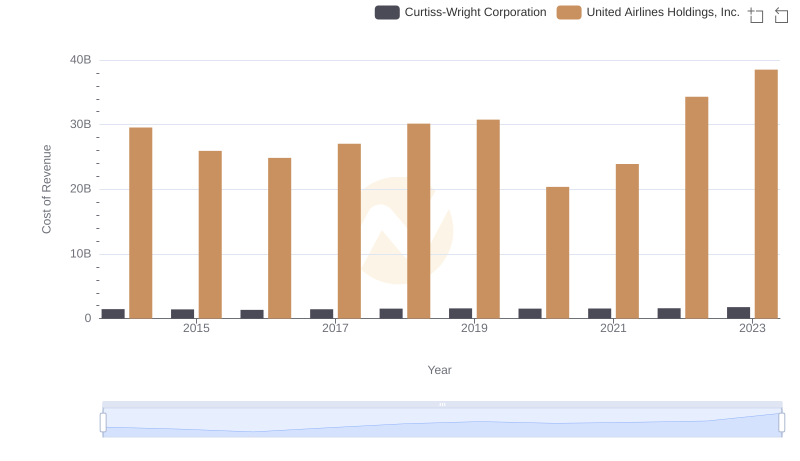
Cost of Revenue: Key Insights for United Airlines Holdings, Inc. and Curtiss-Wright Corporation
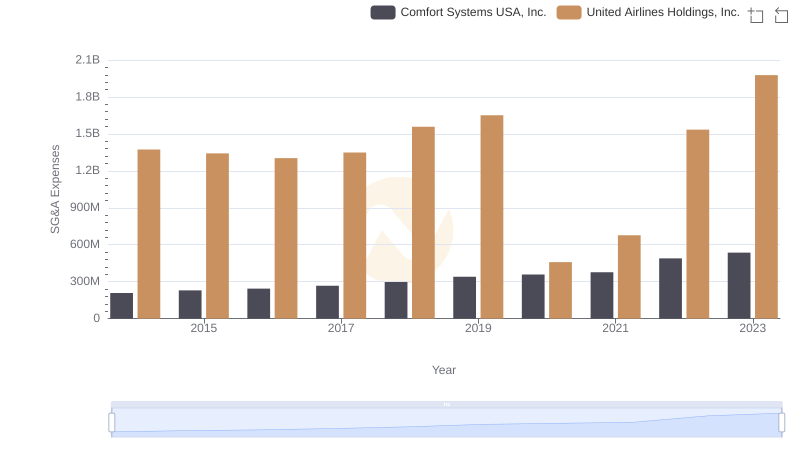
Breaking Down SG&A Expenses: United Airlines Holdings, Inc. vs Comfort Systems USA, Inc.