| __timestamp | American Airlines Group Inc. | Ryanair Holdings plc |
|---|---|---|
| Wednesday, January 1, 2014 | 1544000000 | 192800000 |
| Thursday, January 1, 2015 | 1394000000 | 233900000 |
| Friday, January 1, 2016 | 1323000000 | 292700000 |
| Sunday, January 1, 2017 | 1477000000 | 322300000 |
| Monday, January 1, 2018 | 1520000000 | 410400000 |
| Tuesday, January 1, 2019 | 1602000000 | 547300000 |
| Wednesday, January 1, 2020 | 513000000 | 578800000 |
| Friday, January 1, 2021 | 1098000000 | 201500000 |
| Saturday, January 1, 2022 | 1815000000 | 411300000 |
| Sunday, January 1, 2023 | 1799000000 | 674400000 |
| Monday, January 1, 2024 | 757200000 |
Igniting the spark of knowledge
In the competitive skies of the airline industry, managing costs is crucial for profitability. This analysis delves into the Selling, General, and Administrative (SG&A) expenses of Ryanair Holdings plc and American Airlines Group Inc. from 2014 to 2023. American Airlines, a major player in the U.S., consistently reported higher SG&A expenses, peaking in 2022 with a 29% increase from 2016. In contrast, Ryanair, Europe's low-cost leader, maintained a leaner cost structure, with expenses rising by 131% over the same period. Notably, 2020 marked a significant dip for American Airlines, reflecting the pandemic's impact, while Ryanair's expenses surged by 98% in 2023, indicating strategic investments. Missing data for American Airlines in 2024 suggests a potential shift or reporting delay. This comparison highlights the diverse strategies airlines employ to navigate economic challenges and opportunities.
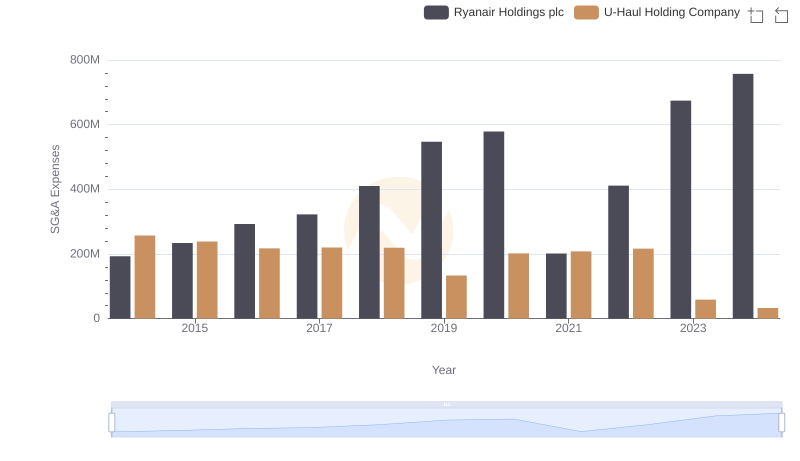
Selling, General, and Administrative Costs: Ryanair Holdings plc vs U-Haul Holding Company
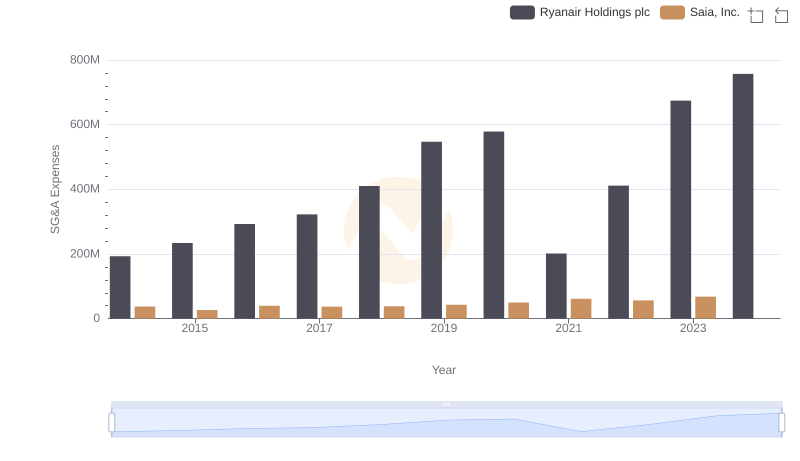
Ryanair Holdings plc vs Saia, Inc.: SG&A Expense Trends
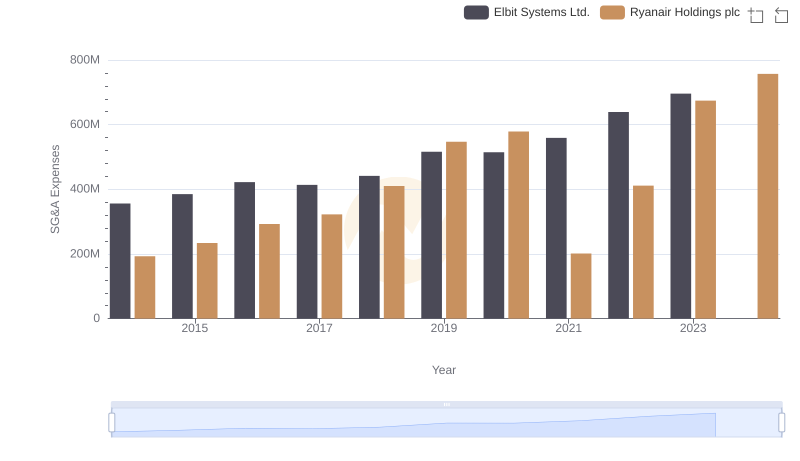
Selling, General, and Administrative Costs: Ryanair Holdings plc vs Elbit Systems Ltd.
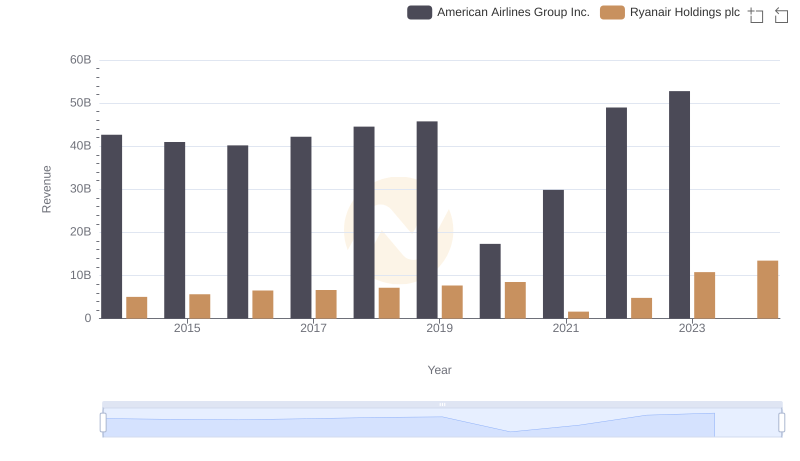
Comparing Revenue Performance: Ryanair Holdings plc or American Airlines Group Inc.?
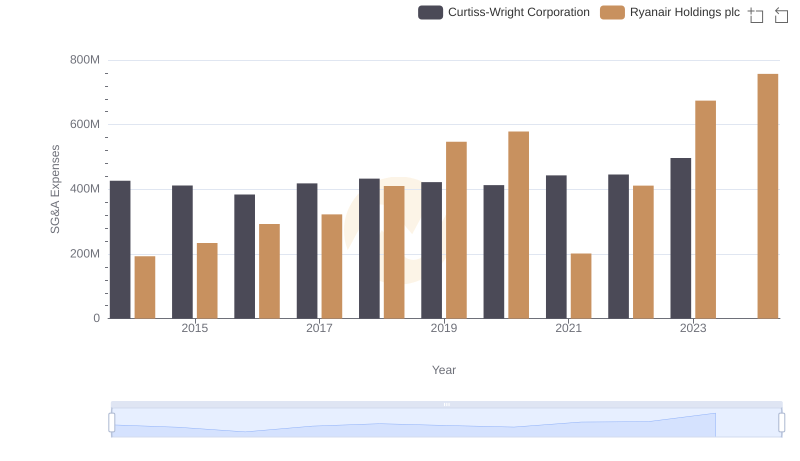
SG&A Efficiency Analysis: Comparing Ryanair Holdings plc and Curtiss-Wright Corporation
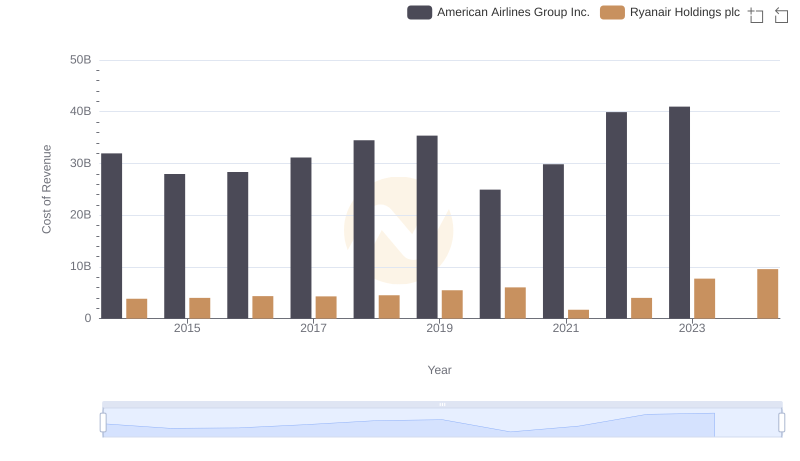
Cost of Revenue Comparison: Ryanair Holdings plc vs American Airlines Group Inc.
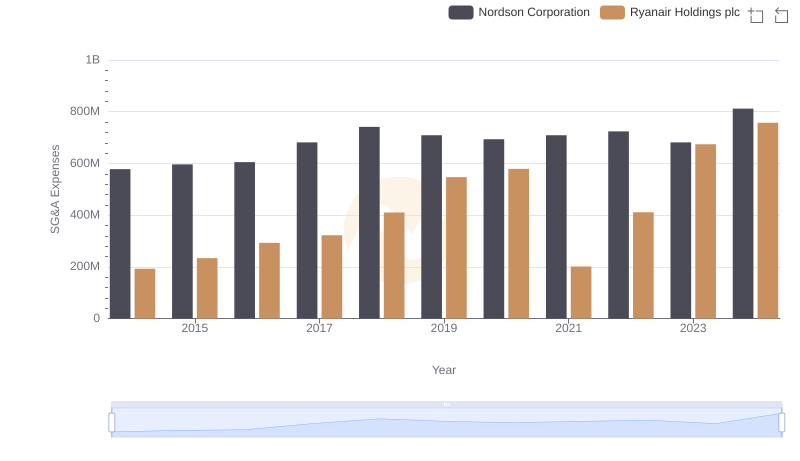
Ryanair Holdings plc and Nordson Corporation: SG&A Spending Patterns Compared
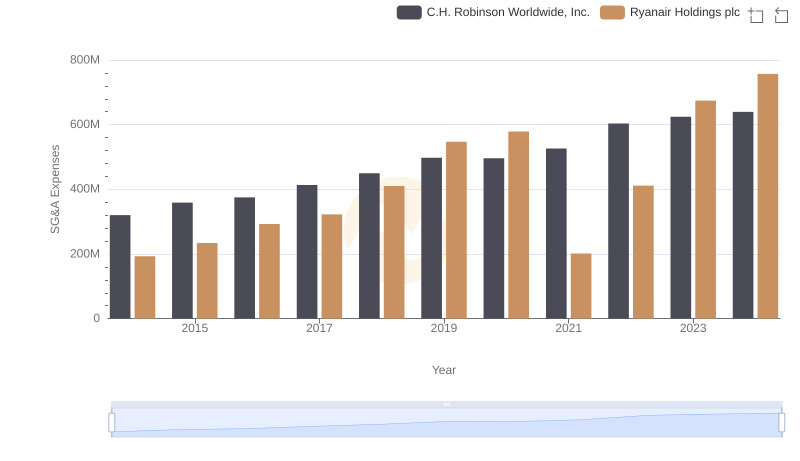
Ryanair Holdings plc vs C.H. Robinson Worldwide, Inc.: SG&A Expense Trends
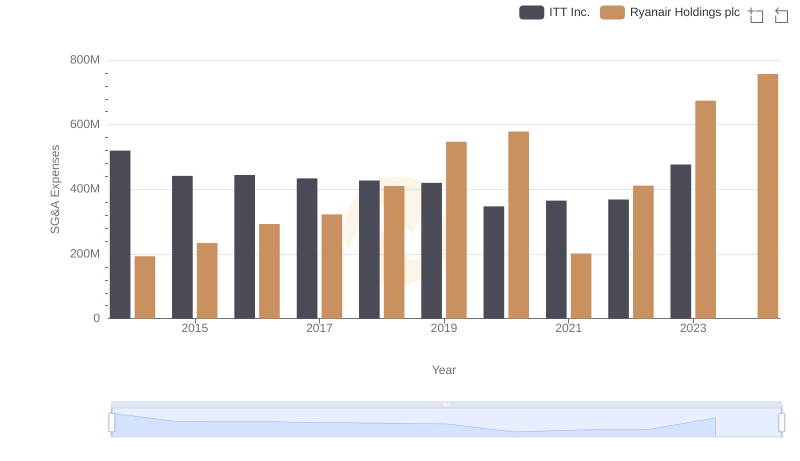
Ryanair Holdings plc and ITT Inc.: SG&A Spending Patterns Compared

Ryanair Holdings plc vs Rentokil Initial plc: SG&A Expense Trends
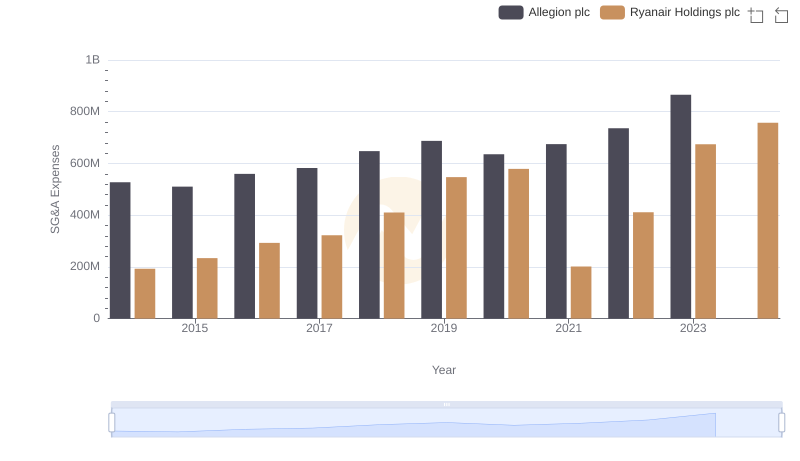
Who Optimizes SG&A Costs Better? Ryanair Holdings plc or Allegion plc