| __timestamp | American Airlines Group Inc. | Ryanair Holdings plc |
|---|---|---|
| Wednesday, January 1, 2014 | 42650000000 | 5036700000 |
| Thursday, January 1, 2015 | 40990000000 | 5654000000 |
| Friday, January 1, 2016 | 40180000000 | 6535800000 |
| Sunday, January 1, 2017 | 42207000000 | 6647800000 |
| Monday, January 1, 2018 | 44541000000 | 7151000000 |
| Tuesday, January 1, 2019 | 45768000000 | 7697400000 |
| Wednesday, January 1, 2020 | 17337000000 | 8494799999 |
| Friday, January 1, 2021 | 29882000000 | 1635800000 |
| Saturday, January 1, 2022 | 48971000000 | 4800900000 |
| Sunday, January 1, 2023 | 52788000000 | 10775200000 |
| Monday, January 1, 2024 | 13443800000 |
Unleashing insights
In the competitive skies of the airline industry, revenue performance is a key indicator of success. From 2014 to 2023, American Airlines Group Inc. and Ryanair Holdings plc have showcased contrasting revenue trajectories. American Airlines, a giant in the U.S. market, saw its revenue peak in 2023, reaching approximately 30% higher than its 2014 figures. However, the pandemic year of 2020 marked a significant dip, with revenues plummeting by nearly 60% compared to the previous year.
On the other hand, Ryanair, Europe's low-cost leader, demonstrated resilience with a steady upward trend. By 2023, Ryanair's revenue had more than doubled since 2014, despite a sharp decline in 2021. This growth trajectory highlights Ryanair's strategic adaptability in a volatile market. As we look to the future, these trends offer insights into the evolving dynamics of the global airline industry.
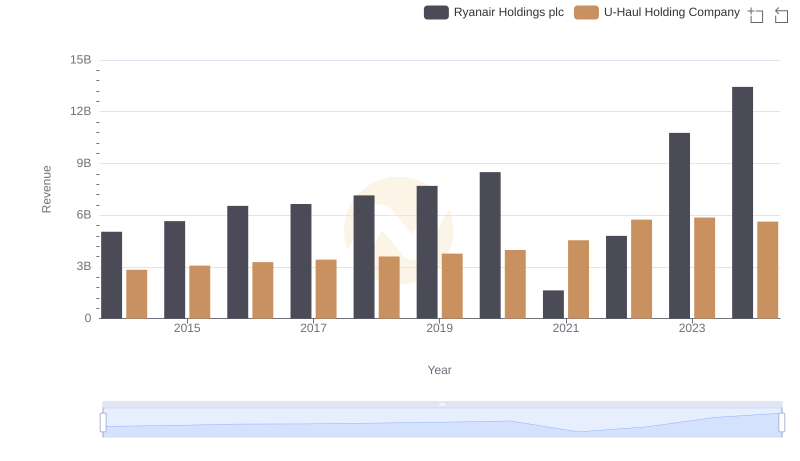
Breaking Down Revenue Trends: Ryanair Holdings plc vs U-Haul Holding Company
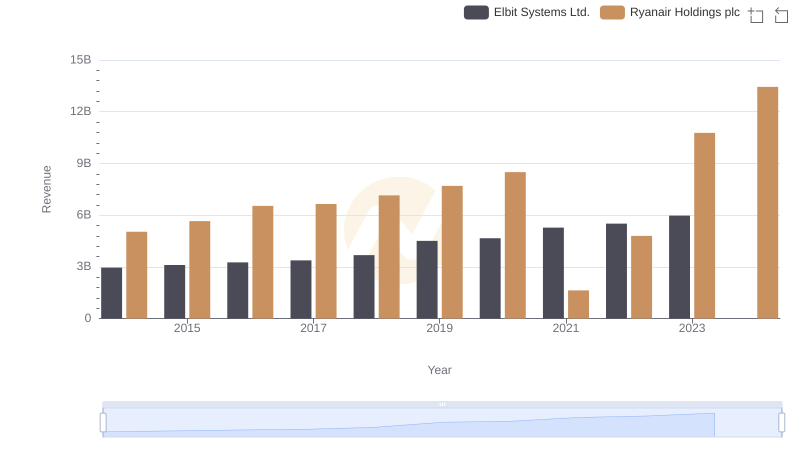
Who Generates More Revenue? Ryanair Holdings plc or Elbit Systems Ltd.
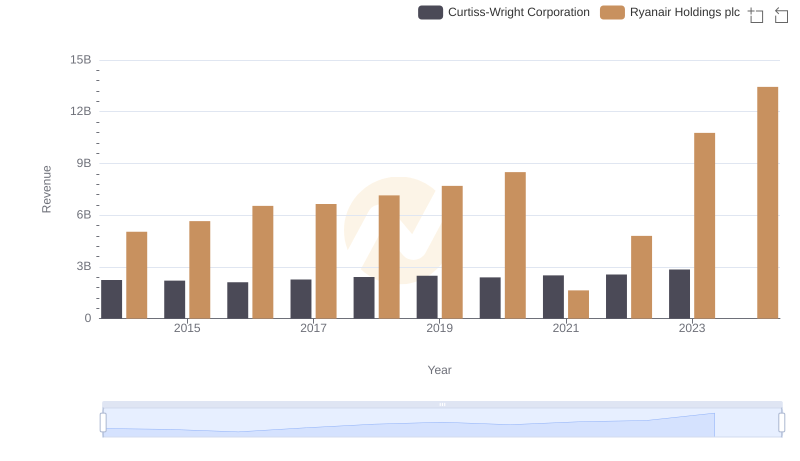
Ryanair Holdings plc vs Curtiss-Wright Corporation: Examining Key Revenue Metrics
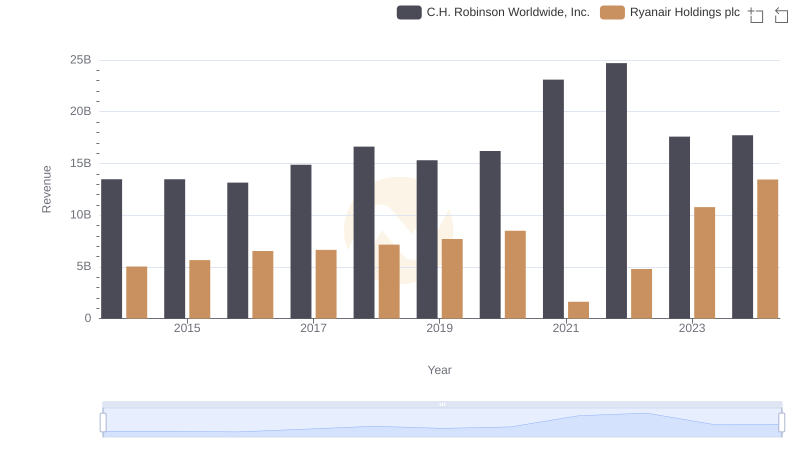
Ryanair Holdings plc vs C.H. Robinson Worldwide, Inc.: Examining Key Revenue Metrics
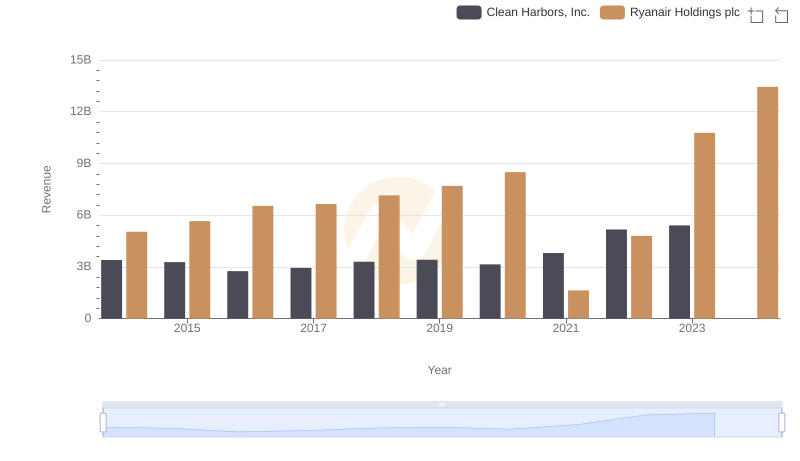
Revenue Showdown: Ryanair Holdings plc vs Clean Harbors, Inc.
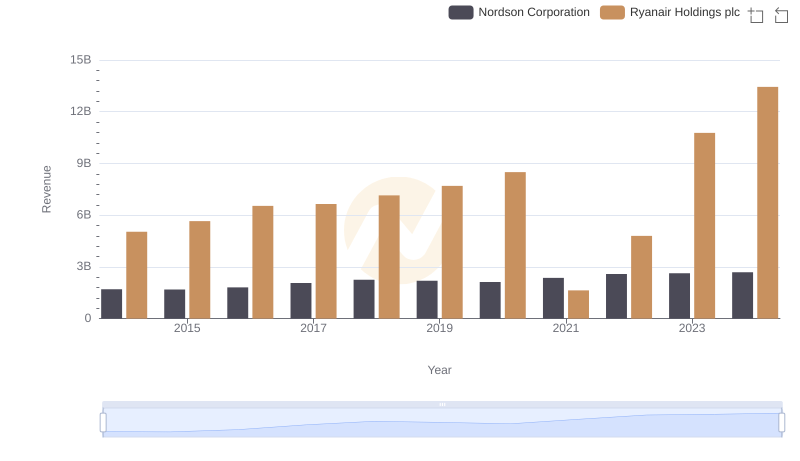
Annual Revenue Comparison: Ryanair Holdings plc vs Nordson Corporation
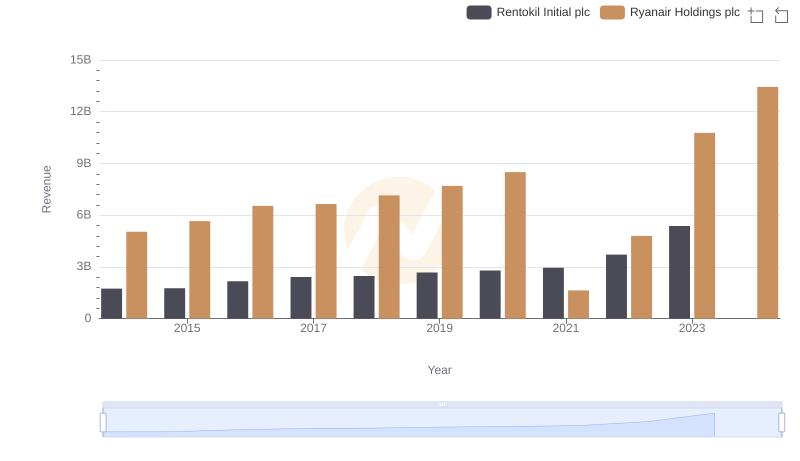
Annual Revenue Comparison: Ryanair Holdings plc vs Rentokil Initial plc
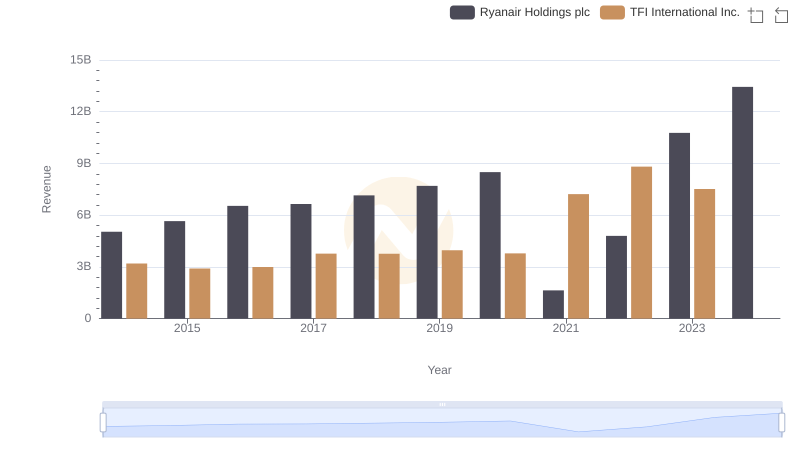
Comparing Revenue Performance: Ryanair Holdings plc or TFI International Inc.?
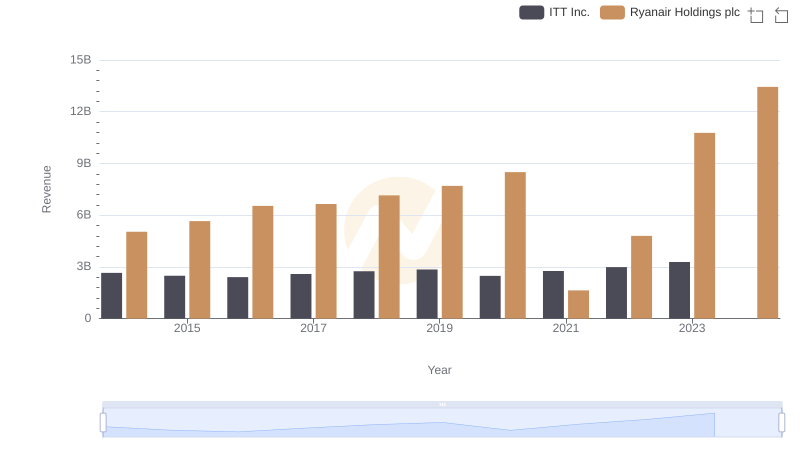
Who Generates More Revenue? Ryanair Holdings plc or ITT Inc.
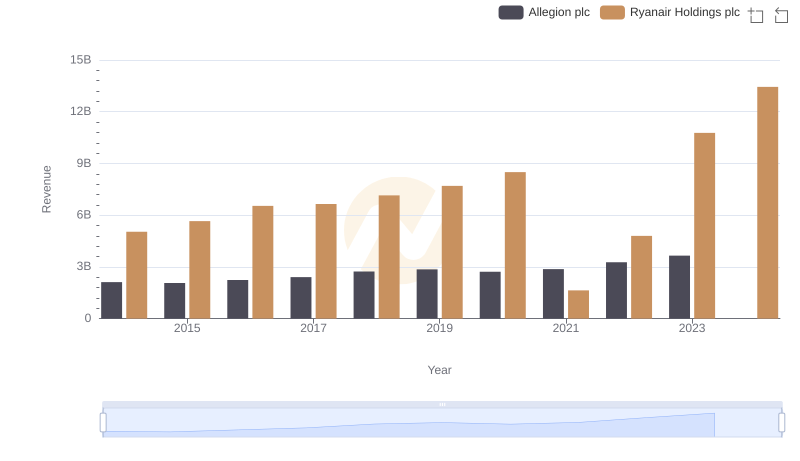
Revenue Insights: Ryanair Holdings plc and Allegion plc Performance Compared
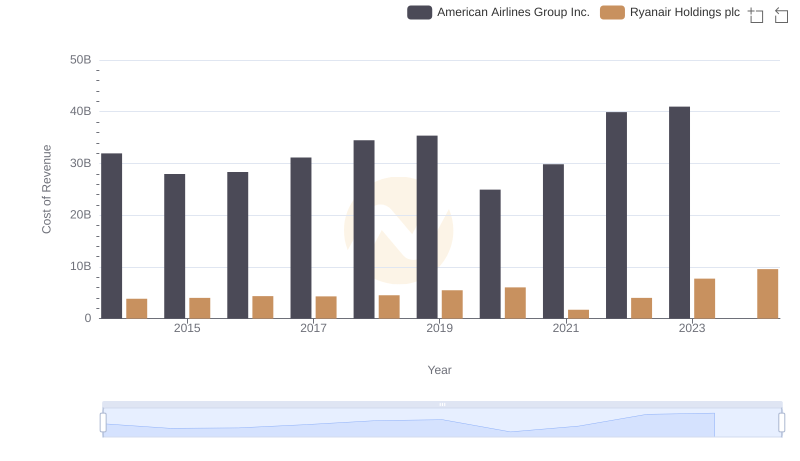
Cost of Revenue Comparison: Ryanair Holdings plc vs American Airlines Group Inc.
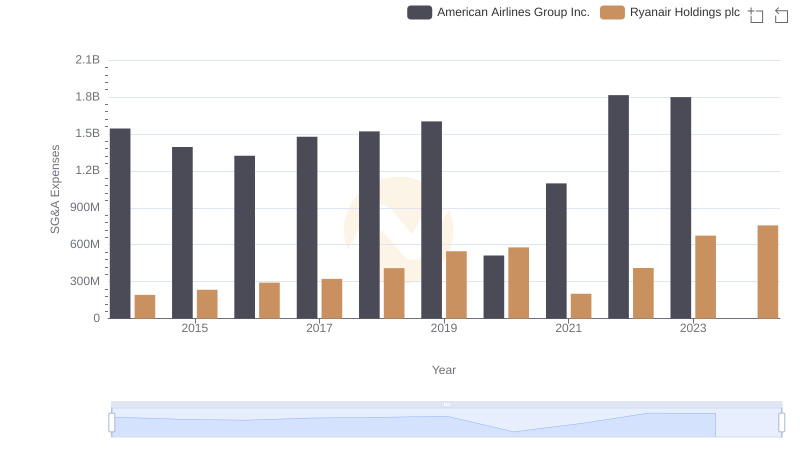
Breaking Down SG&A Expenses: Ryanair Holdings plc vs American Airlines Group Inc.