| __timestamp | Rentokil Initial plc | Ryanair Holdings plc |
|---|---|---|
| Wednesday, January 1, 2014 | 935700000 | 192800000 |
| Thursday, January 1, 2015 | 965700000 | 233900000 |
| Friday, January 1, 2016 | 1197600000 | 292700000 |
| Sunday, January 1, 2017 | 1329600000 | 322300000 |
| Monday, January 1, 2018 | 1364000000 | 410400000 |
| Tuesday, January 1, 2019 | 322500000 | 547300000 |
| Wednesday, January 1, 2020 | 352000000 | 578800000 |
| Friday, January 1, 2021 | 348600000 | 201500000 |
| Saturday, January 1, 2022 | 479000000 | 411300000 |
| Sunday, January 1, 2023 | 2870000000 | 674400000 |
| Monday, January 1, 2024 | 757200000 |
Unleashing insights
In the ever-evolving landscape of corporate finance, understanding the trends in Selling, General, and Administrative (SG&A) expenses is crucial for investors and analysts alike. Over the past decade, Rentokil Initial plc and Ryanair Holdings plc have showcased contrasting trajectories in their SG&A expenses.
From 2014 to 2023, Rentokil Initial plc's SG&A expenses surged by approximately 200%, peaking in 2023. This reflects a strategic expansion and investment in operational capabilities. In contrast, Ryanair Holdings plc exhibited a more modest increase of around 250% over the same period, with a notable dip in 2021, likely due to pandemic-related disruptions.
These trends highlight the differing strategic priorities of the two companies, with Rentokil focusing on aggressive growth and Ryanair maintaining a leaner operational model. As we look to the future, these insights provide a window into the financial health and strategic direction of these industry giants.
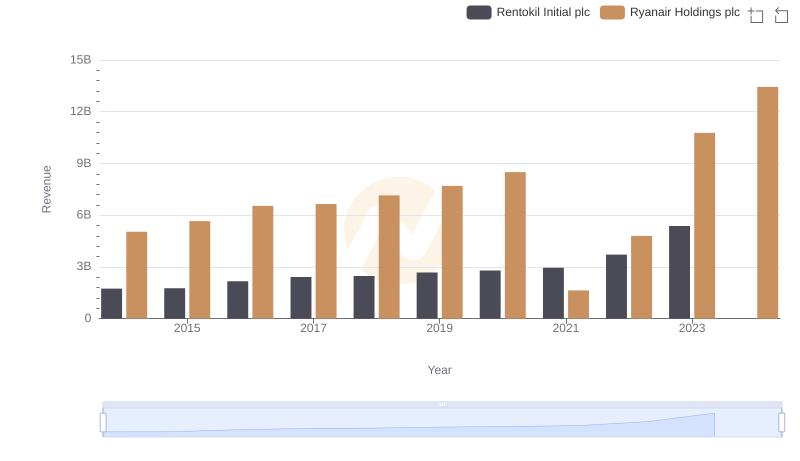
Annual Revenue Comparison: Ryanair Holdings plc vs Rentokil Initial plc
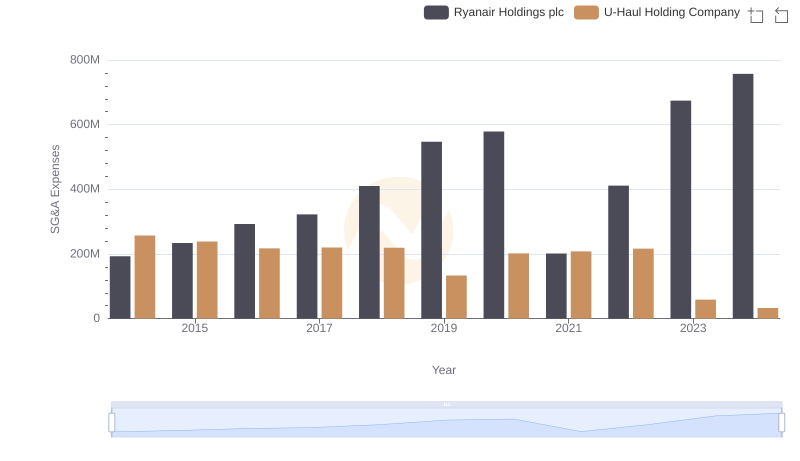
Selling, General, and Administrative Costs: Ryanair Holdings plc vs U-Haul Holding Company
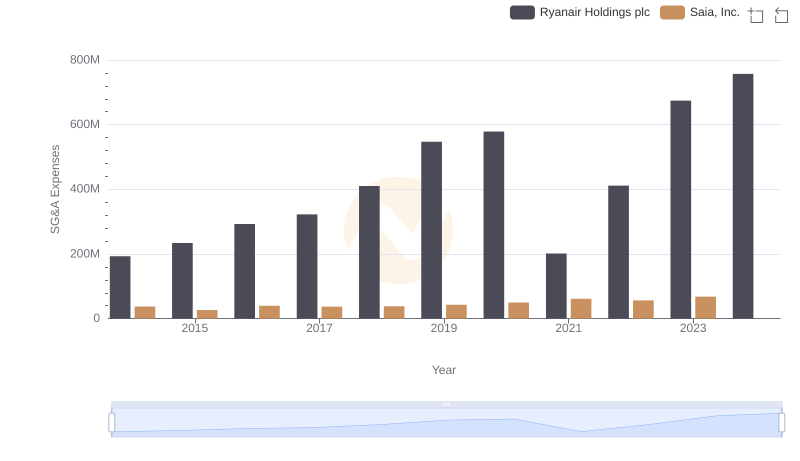
Ryanair Holdings plc vs Saia, Inc.: SG&A Expense Trends
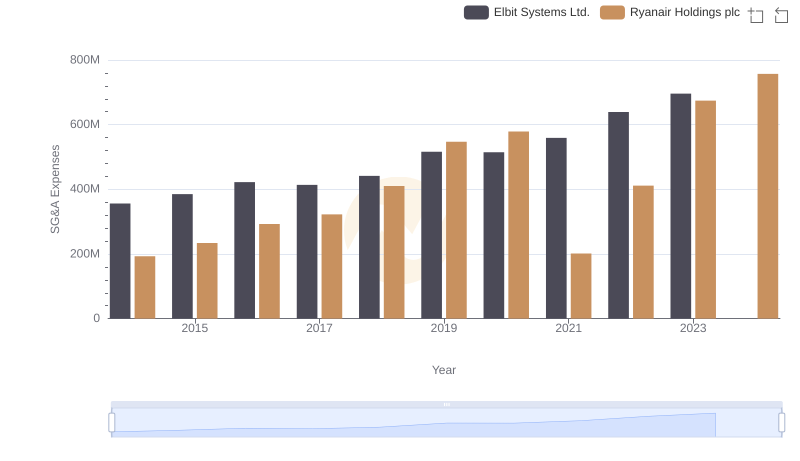
Selling, General, and Administrative Costs: Ryanair Holdings plc vs Elbit Systems Ltd.
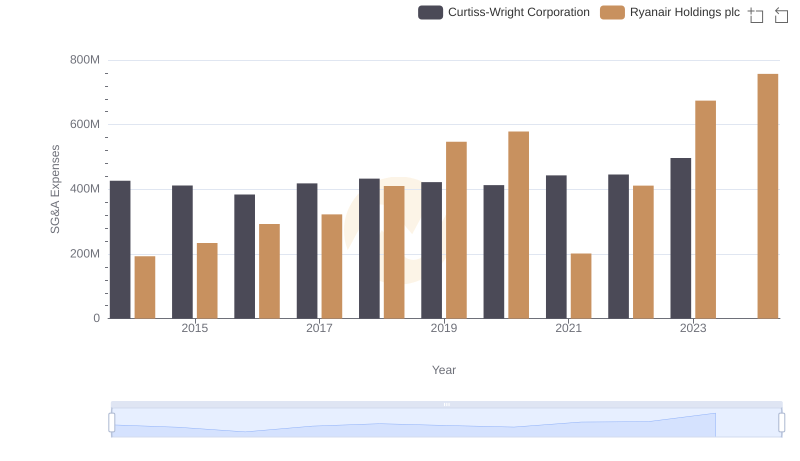
SG&A Efficiency Analysis: Comparing Ryanair Holdings plc and Curtiss-Wright Corporation
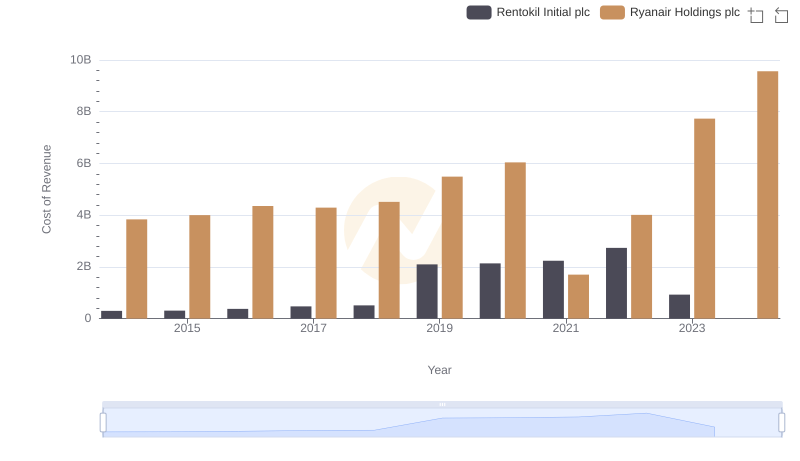
Cost of Revenue: Key Insights for Ryanair Holdings plc and Rentokil Initial plc
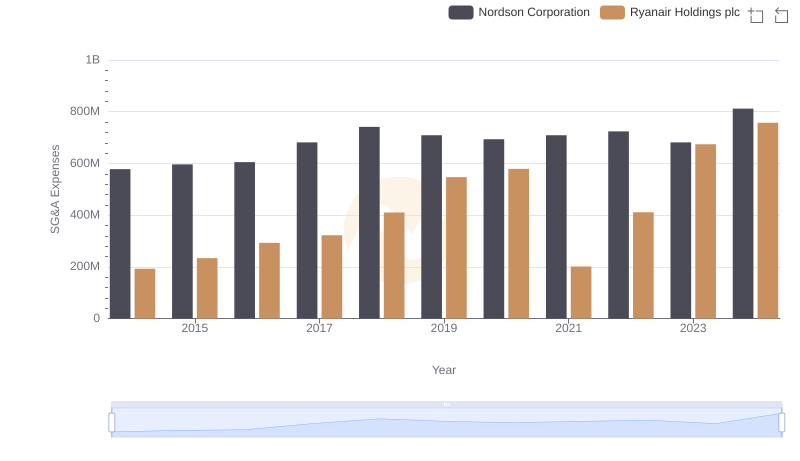
Ryanair Holdings plc and Nordson Corporation: SG&A Spending Patterns Compared
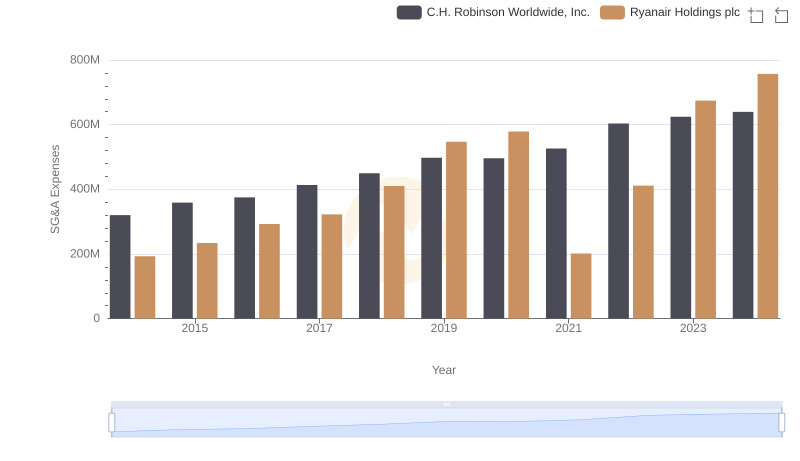
Ryanair Holdings plc vs C.H. Robinson Worldwide, Inc.: SG&A Expense Trends
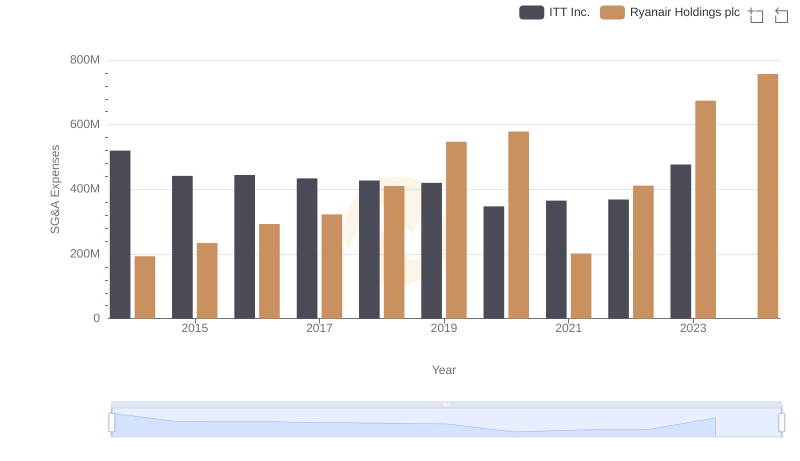
Ryanair Holdings plc and ITT Inc.: SG&A Spending Patterns Compared
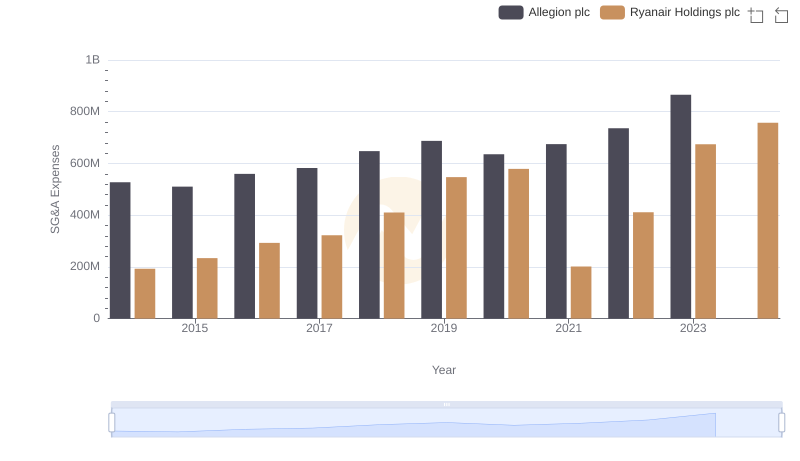
Who Optimizes SG&A Costs Better? Ryanair Holdings plc or Allegion plc
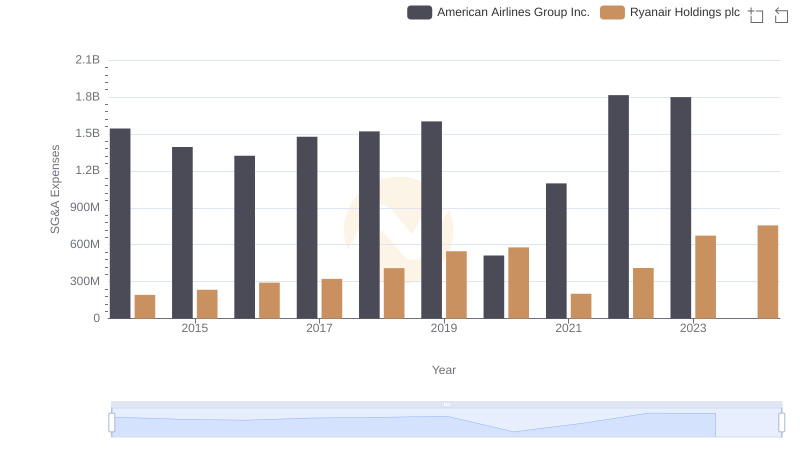
Breaking Down SG&A Expenses: Ryanair Holdings plc vs American Airlines Group Inc.