| __timestamp | American Airlines Group Inc. | Ryanair Holdings plc |
|---|---|---|
| Wednesday, January 1, 2014 | 31939000000 | 3838100000 |
| Thursday, January 1, 2015 | 27967000000 | 3999600000 |
| Friday, January 1, 2016 | 28339000000 | 4355900000 |
| Sunday, January 1, 2017 | 31154000000 | 4294000000 |
| Monday, January 1, 2018 | 34490000000 | 4512300000 |
| Tuesday, January 1, 2019 | 35379000000 | 5492800000 |
| Wednesday, January 1, 2020 | 24933000000 | 6039900000 |
| Friday, January 1, 2021 | 29855000000 | 1702700000 |
| Saturday, January 1, 2022 | 39934000000 | 4009800000 |
| Sunday, January 1, 2023 | 40978000000 | 7735000000 |
| Monday, January 1, 2024 | 9566400000 |
Unleashing insights
In the competitive skies of the airline industry, cost management is crucial. This chart compares the cost of revenue for Ryanair Holdings plc and American Airlines Group Inc. from 2014 to 2023. Over this period, American Airlines consistently reported higher costs, peaking in 2023 with a 28% increase from 2014. In contrast, Ryanair's cost of revenue showed a more dynamic trend, with a notable 102% rise from 2014 to 2023, reflecting its aggressive expansion strategy.
This data highlights the strategic differences between a legacy carrier and a low-cost airline, offering insights into their financial health and operational strategies.
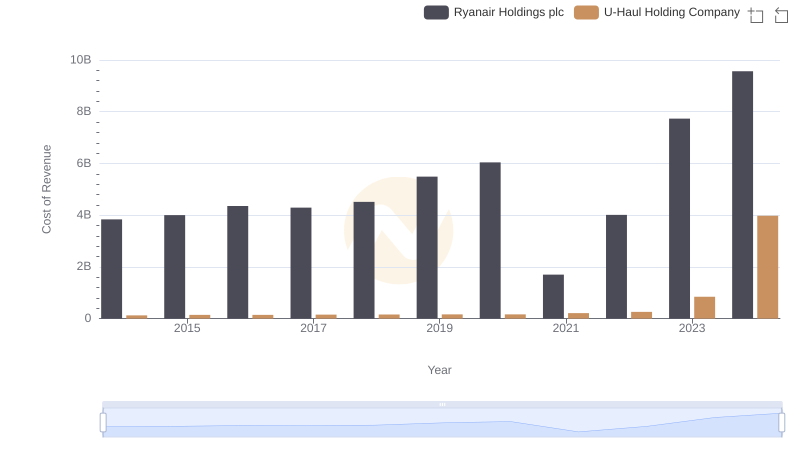
Ryanair Holdings plc vs U-Haul Holding Company: Efficiency in Cost of Revenue Explored
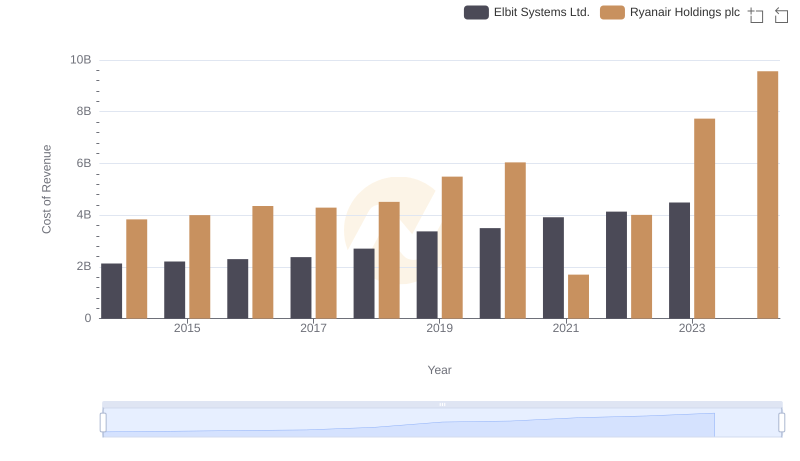
Analyzing Cost of Revenue: Ryanair Holdings plc and Elbit Systems Ltd.
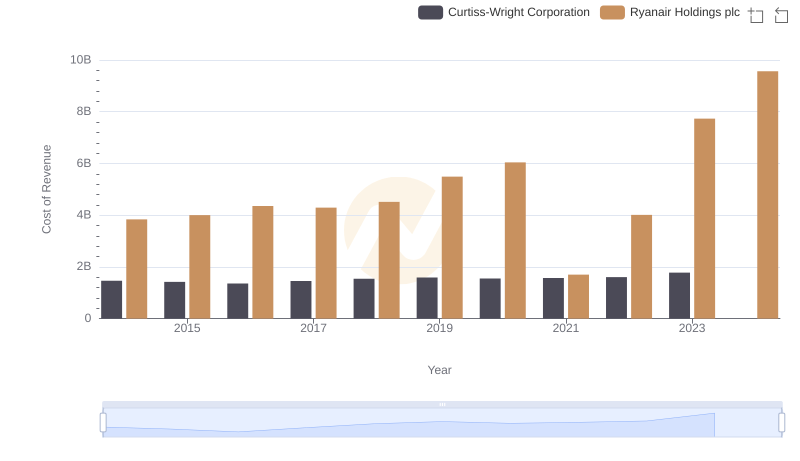
Cost of Revenue Trends: Ryanair Holdings plc vs Curtiss-Wright Corporation
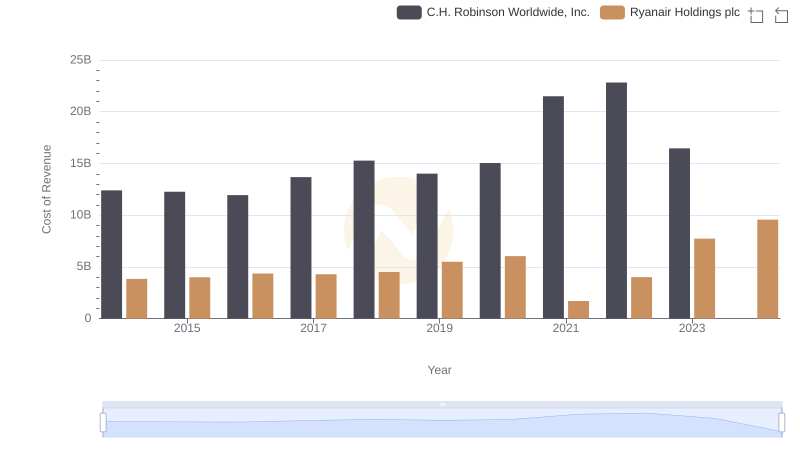
Cost Insights: Breaking Down Ryanair Holdings plc and C.H. Robinson Worldwide, Inc.'s Expenses
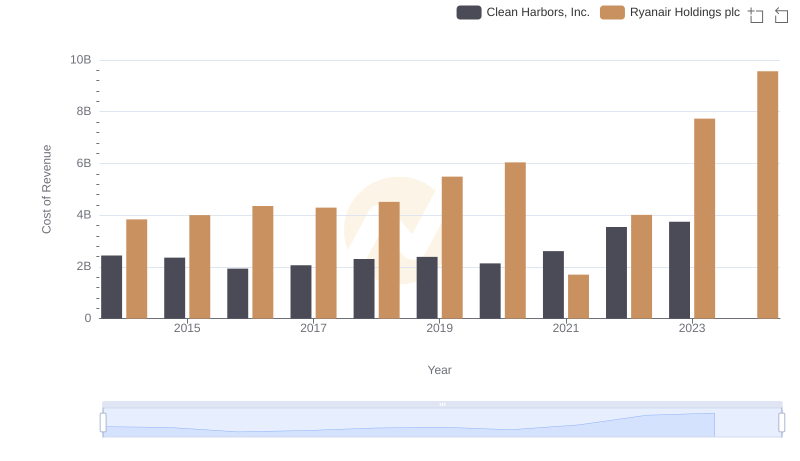
Cost of Revenue Trends: Ryanair Holdings plc vs Clean Harbors, Inc.
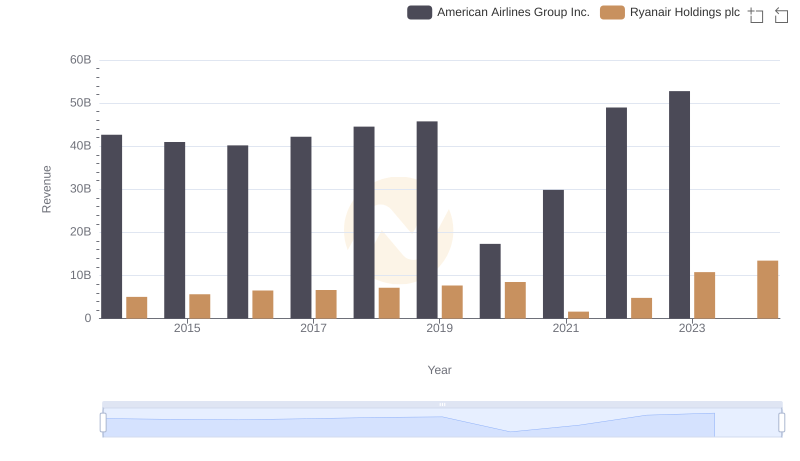
Comparing Revenue Performance: Ryanair Holdings plc or American Airlines Group Inc.?
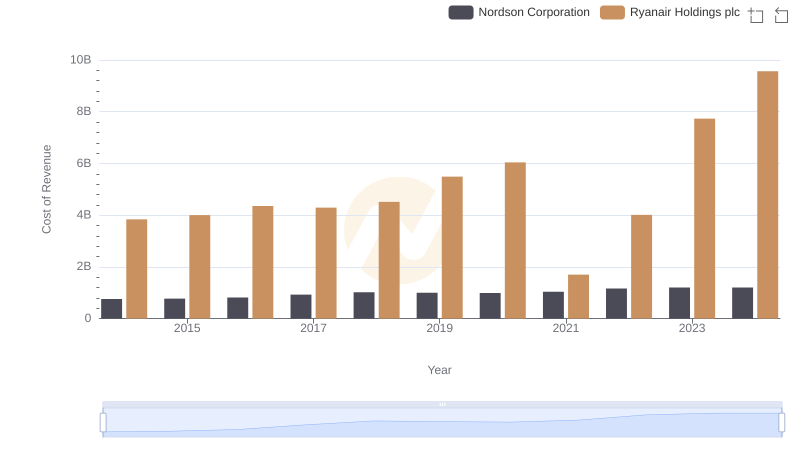
Cost Insights: Breaking Down Ryanair Holdings plc and Nordson Corporation's Expenses
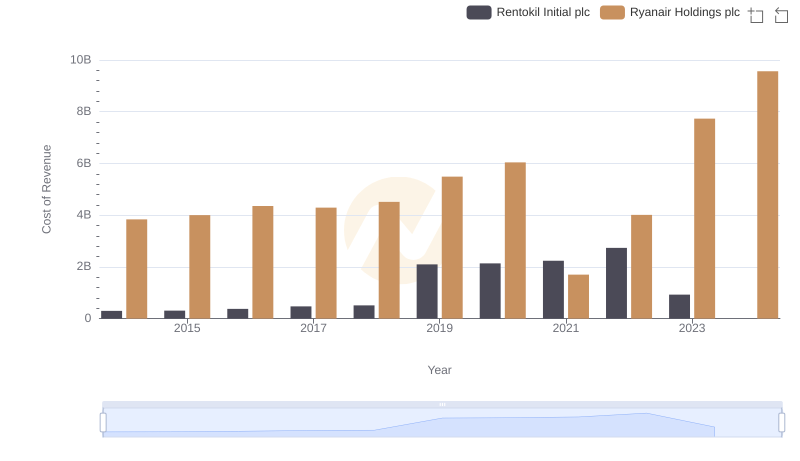
Cost of Revenue: Key Insights for Ryanair Holdings plc and Rentokil Initial plc
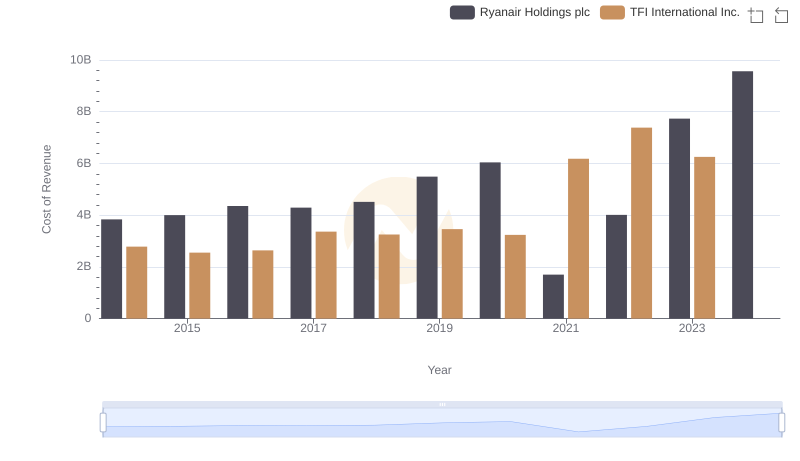
Cost Insights: Breaking Down Ryanair Holdings plc and TFI International Inc.'s Expenses
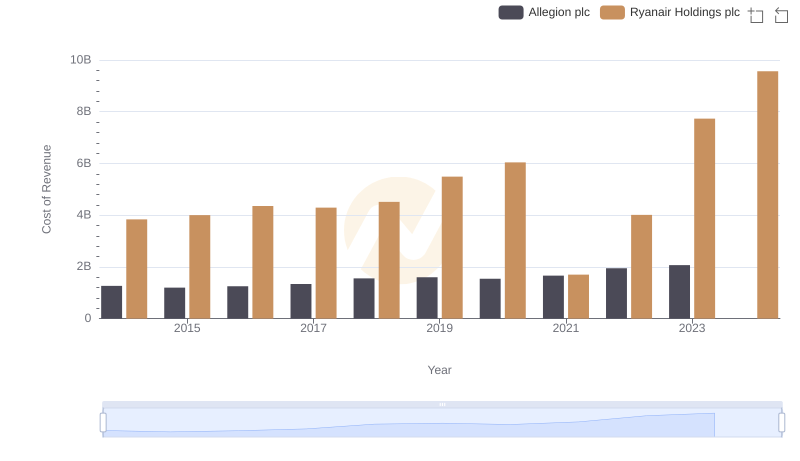
Cost Insights: Breaking Down Ryanair Holdings plc and Allegion plc's Expenses
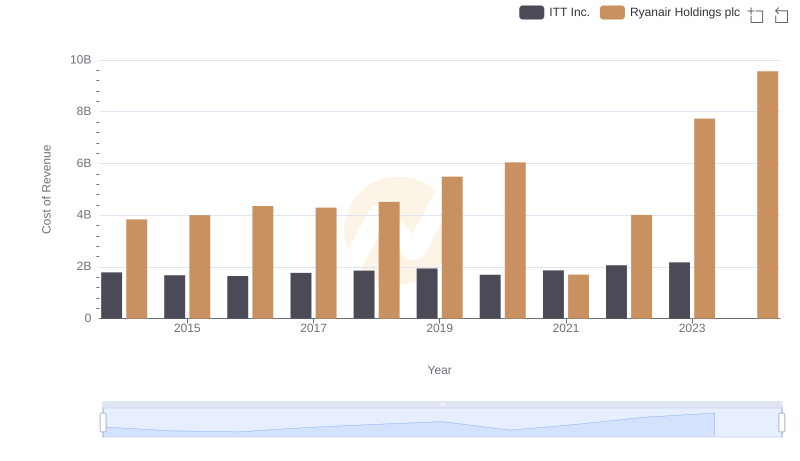
Analyzing Cost of Revenue: Ryanair Holdings plc and ITT Inc.
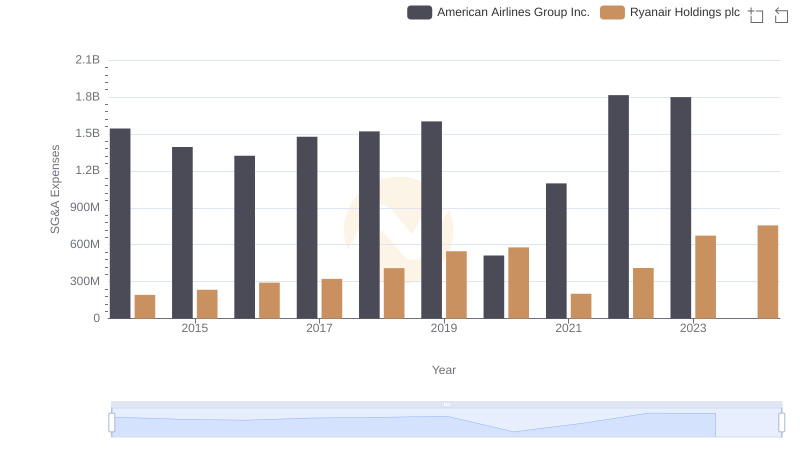
Breaking Down SG&A Expenses: Ryanair Holdings plc vs American Airlines Group Inc.