| __timestamp | Nordson Corporation | Ryanair Holdings plc |
|---|---|---|
| Wednesday, January 1, 2014 | 577993000 | 192800000 |
| Thursday, January 1, 2015 | 596234000 | 233900000 |
| Friday, January 1, 2016 | 605068000 | 292700000 |
| Sunday, January 1, 2017 | 681299000 | 322300000 |
| Monday, January 1, 2018 | 741408000 | 410400000 |
| Tuesday, January 1, 2019 | 708990000 | 547300000 |
| Wednesday, January 1, 2020 | 693552000 | 578800000 |
| Friday, January 1, 2021 | 708953000 | 201500000 |
| Saturday, January 1, 2022 | 724176000 | 411300000 |
| Sunday, January 1, 2023 | 681244000 | 674400000 |
| Monday, January 1, 2024 | 812128000 | 757200000 |
Igniting the spark of knowledge
In the world of corporate finance, understanding a company's spending patterns can reveal much about its strategic priorities. This analysis compares the Selling, General, and Administrative (SG&A) expenses of Ryanair Holdings plc and Nordson Corporation from 2014 to 2024.
Over the past decade, Nordson Corporation has consistently outspent Ryanair in SG&A expenses, with an average annual expenditure of approximately $685 million. In contrast, Ryanair's average was around $420 million. Notably, Ryanair's SG&A expenses surged by 250% from 2014 to 2024, reflecting strategic shifts or market expansions. Meanwhile, Nordson's expenses grew by about 40%, indicating steady growth.
These spending patterns suggest differing strategic focuses: Ryanair's aggressive expansion and Nordson's steady growth. Investors and analysts can glean insights into each company's operational priorities and market strategies through these financial trends.
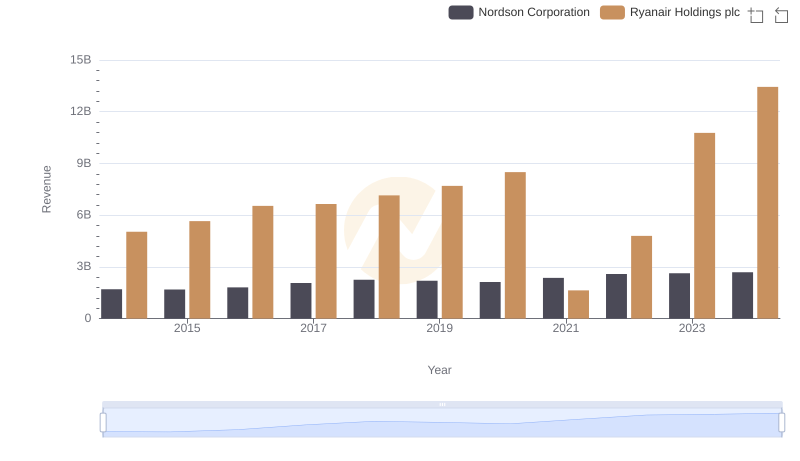
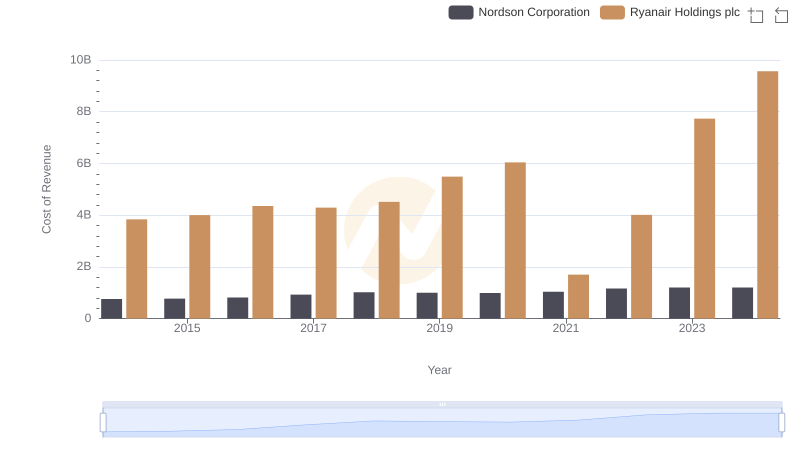
Annual Revenue Comparison: Ryanair Holdings plc vs Nordson Corporation
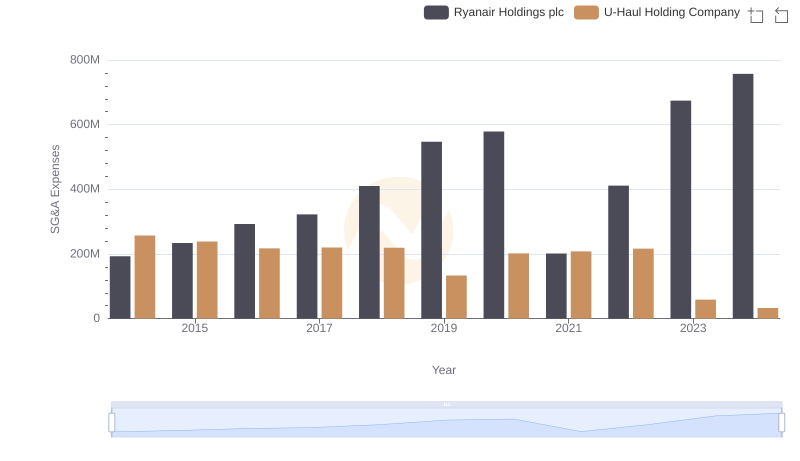
Selling, General, and Administrative Costs: Ryanair Holdings plc vs U-Haul Holding Company
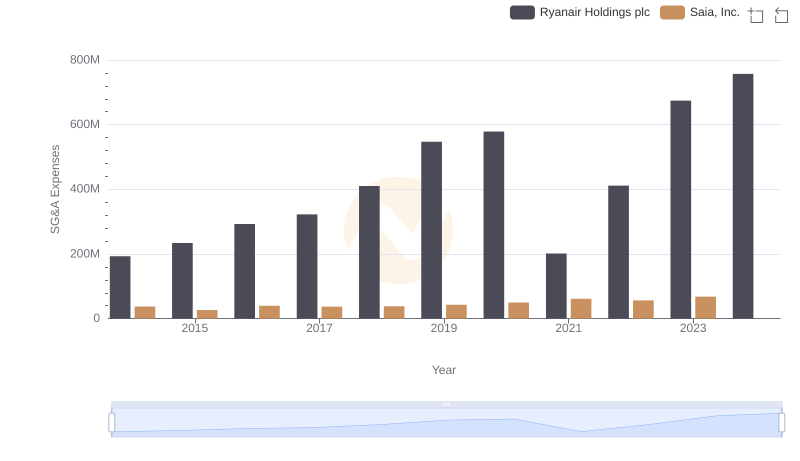
Ryanair Holdings plc vs Saia, Inc.: SG&A Expense Trends
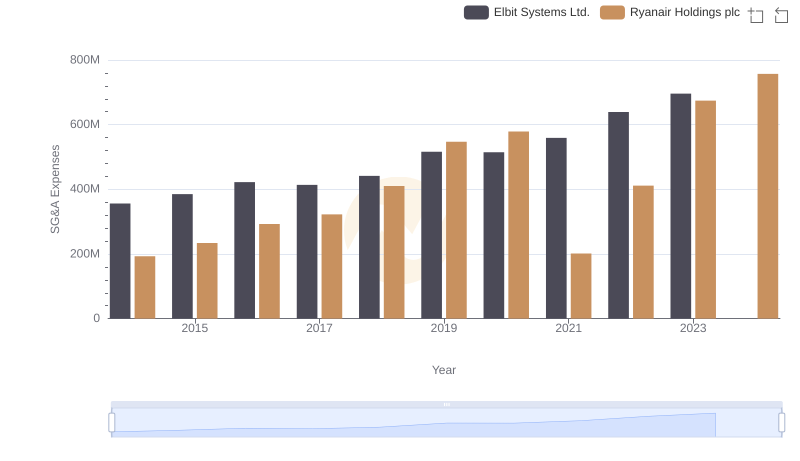
Selling, General, and Administrative Costs: Ryanair Holdings plc vs Elbit Systems Ltd.
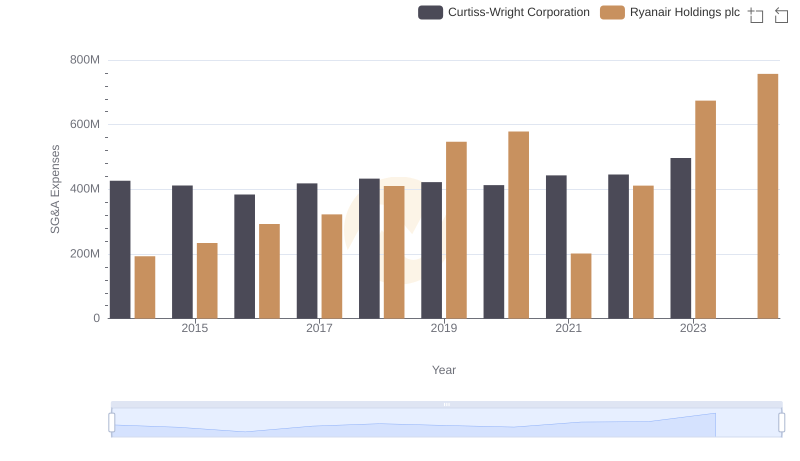
SG&A Efficiency Analysis: Comparing Ryanair Holdings plc and Curtiss-Wright Corporation
Cost Insights: Breaking Down Ryanair Holdings plc and Nordson Corporation's Expenses
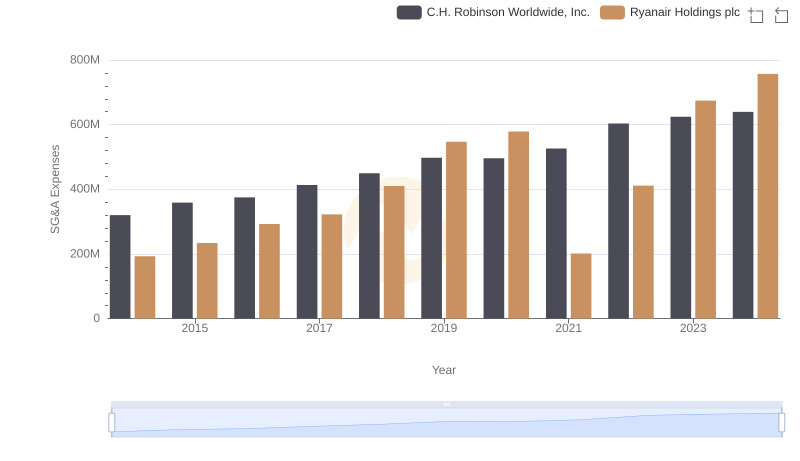
Ryanair Holdings plc vs C.H. Robinson Worldwide, Inc.: SG&A Expense Trends
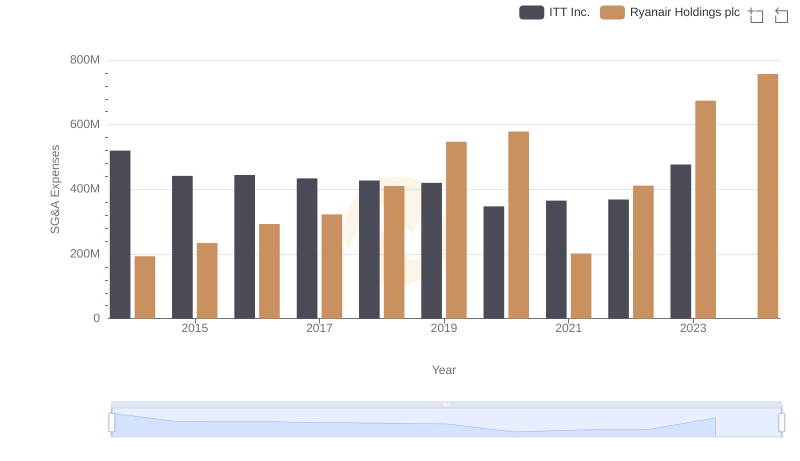
Ryanair Holdings plc and ITT Inc.: SG&A Spending Patterns Compared

Ryanair Holdings plc vs Rentokil Initial plc: SG&A Expense Trends
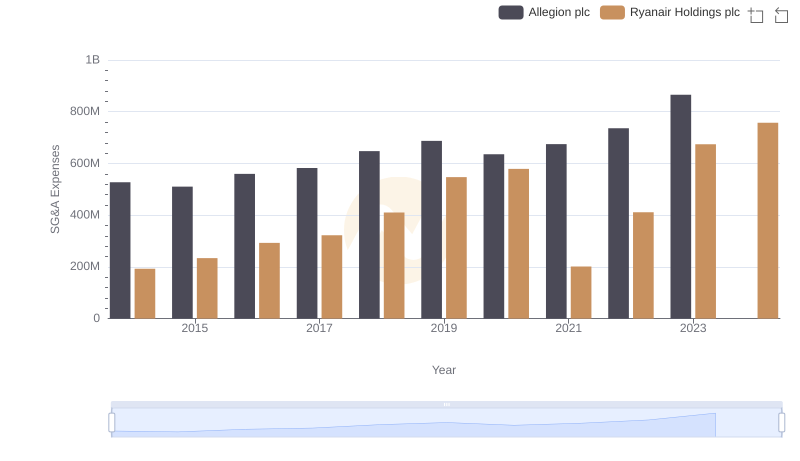
Who Optimizes SG&A Costs Better? Ryanair Holdings plc or Allegion plc
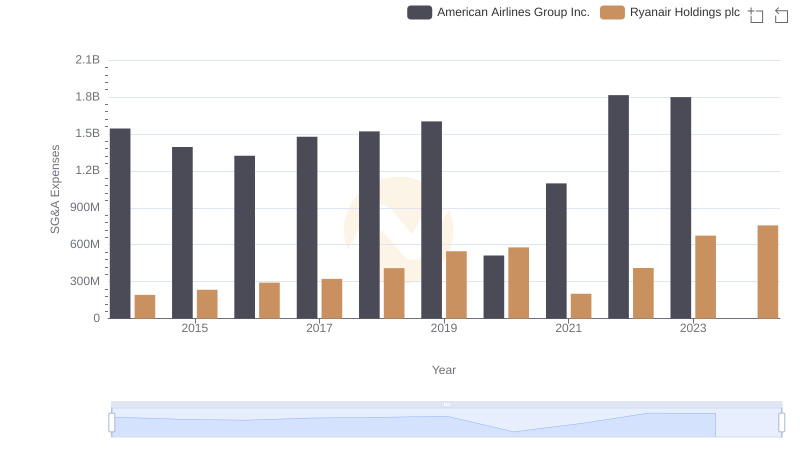
Breaking Down SG&A Expenses: Ryanair Holdings plc vs American Airlines Group Inc.