| __timestamp | Axon Enterprise, Inc. | Global Payments Inc. |
|---|---|---|
| Wednesday, January 1, 2014 | 54158000 | 1295014000 |
| Thursday, January 1, 2015 | 69698000 | 1325567000 |
| Friday, January 1, 2016 | 108076000 | 1411096000 |
| Sunday, January 1, 2017 | 138692000 | 1488258000 |
| Monday, January 1, 2018 | 156886000 | 1534297000 |
| Tuesday, January 1, 2019 | 212959000 | 2046672000 |
| Wednesday, January 1, 2020 | 307286000 | 2878878000 |
| Friday, January 1, 2021 | 515007000 | 3391161000 |
| Saturday, January 1, 2022 | 401575000 | 3524578000 |
| Sunday, January 1, 2023 | 496874000 | 4073768000 |
| Monday, January 1, 2024 | 4285307000 |
Infusing magic into the data realm
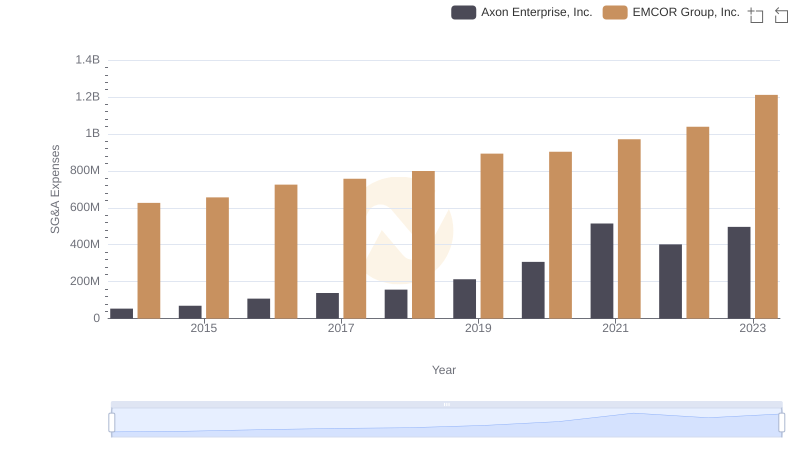
In the ever-evolving landscape of corporate finance, understanding the nuances of Selling, General, and Administrative (SG&A) expenses is crucial. Over the past decade, from 2014 to 2023, Axon Enterprise, Inc. and Global Payments Inc. have demonstrated distinct trajectories in their SG&A expenditures.
Axon Enterprise, Inc. has seen a remarkable increase in its SG&A expenses, growing by approximately 817% from 2014 to 2023. This surge reflects the company's aggressive expansion and investment in administrative capabilities. In contrast, Global Payments Inc. has maintained a more stable growth, with its SG&A expenses increasing by about 214% over the same period. This steady rise underscores the company's strategic focus on operational efficiency and cost management.
These trends highlight the diverse strategies employed by these industry leaders, offering valuable insights into their financial health and strategic priorities.
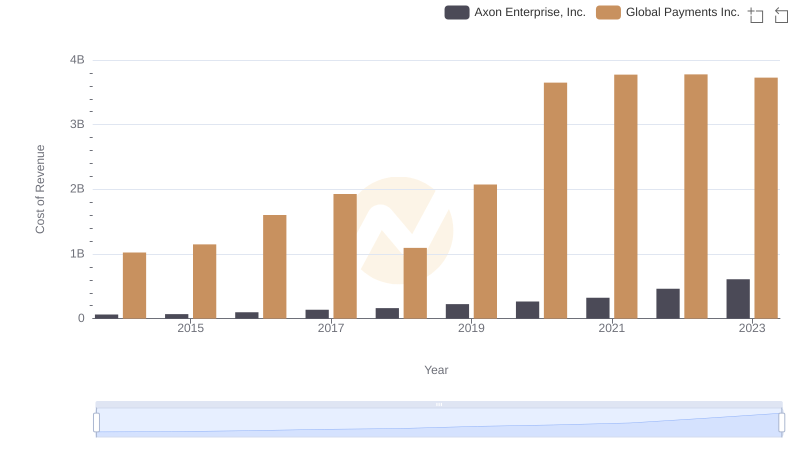
Cost Insights: Breaking Down Axon Enterprise, Inc. and Global Payments Inc.'s Expenses
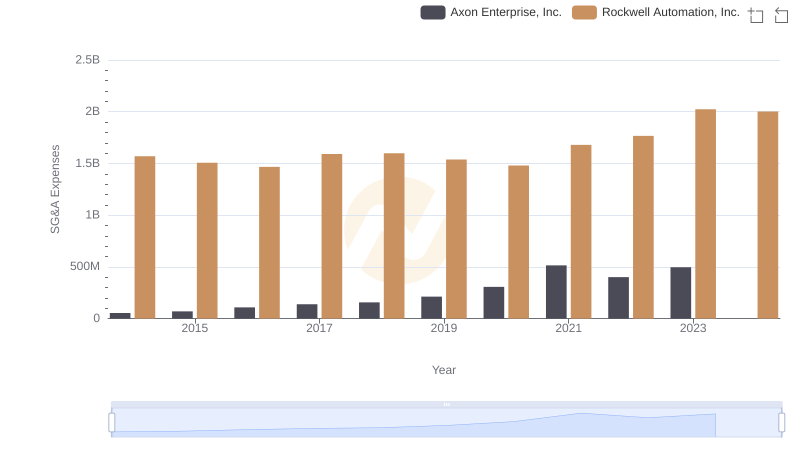
Operational Costs Compared: SG&A Analysis of Axon Enterprise, Inc. and Rockwell Automation, Inc.
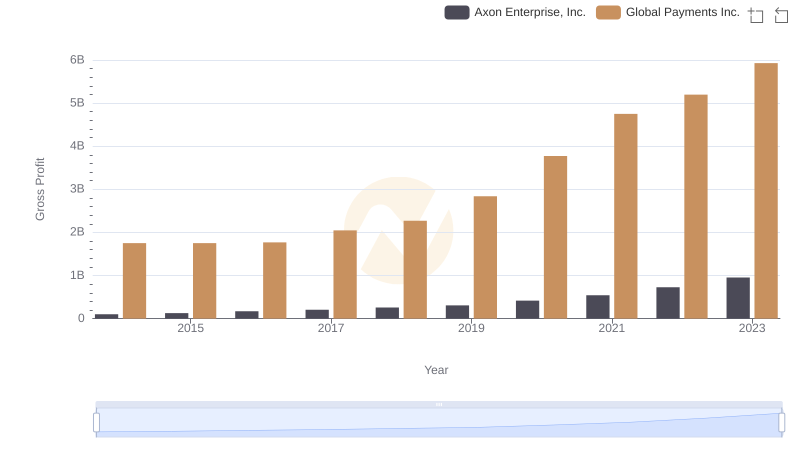
Axon Enterprise, Inc. and Global Payments Inc.: A Detailed Gross Profit Analysis
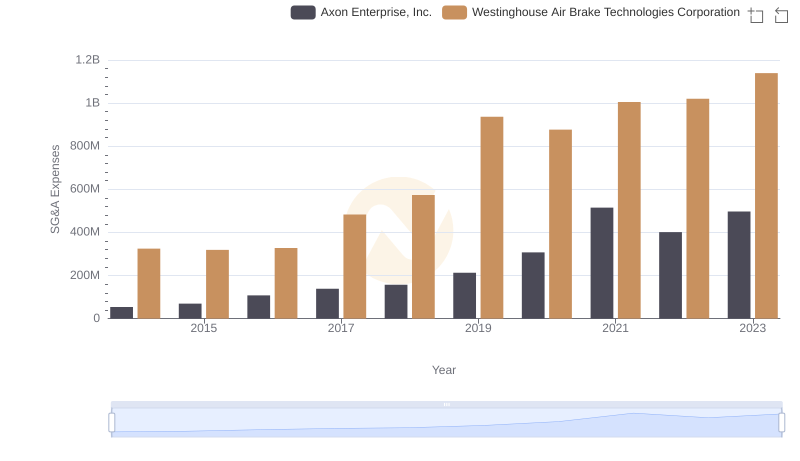
Selling, General, and Administrative Costs: Axon Enterprise, Inc. vs Westinghouse Air Brake Technologies Corporation
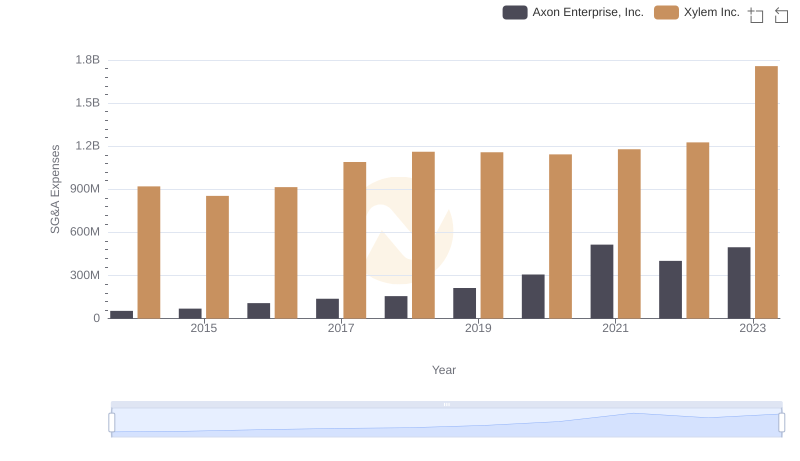
Axon Enterprise, Inc. vs Xylem Inc.: SG&A Expense Trends
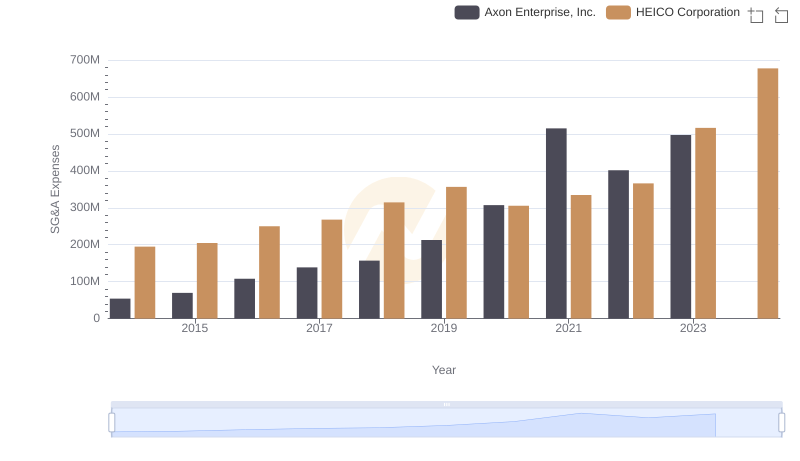
Operational Costs Compared: SG&A Analysis of Axon Enterprise, Inc. and HEICO Corporation
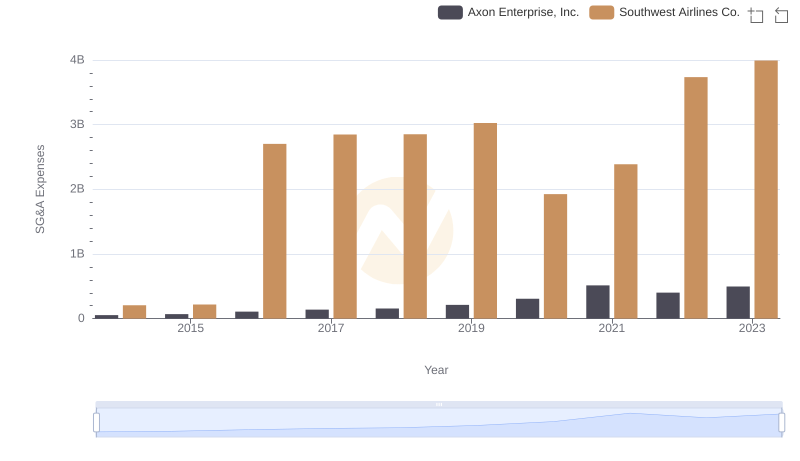
Who Optimizes SG&A Costs Better? Axon Enterprise, Inc. or Southwest Airlines Co.
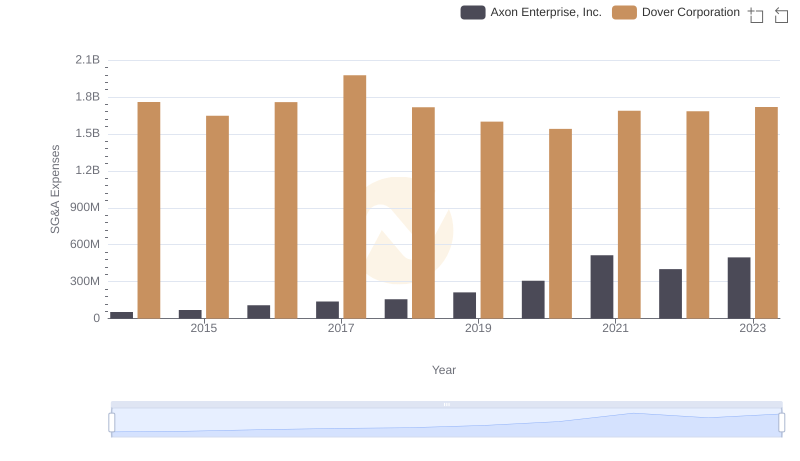
Selling, General, and Administrative Costs: Axon Enterprise, Inc. vs Dover Corporation
SG&A Efficiency Analysis: Comparing Axon Enterprise, Inc. and EMCOR Group, Inc.