| __timestamp | Axon Enterprise, Inc. | Rockwell Automation, Inc. |
|---|---|---|
| Wednesday, January 1, 2014 | 54158000 | 1570100000 |
| Thursday, January 1, 2015 | 69698000 | 1506400000 |
| Friday, January 1, 2016 | 108076000 | 1467400000 |
| Sunday, January 1, 2017 | 138692000 | 1591500000 |
| Monday, January 1, 2018 | 156886000 | 1599000000 |
| Tuesday, January 1, 2019 | 212959000 | 1538500000 |
| Wednesday, January 1, 2020 | 307286000 | 1479800000 |
| Friday, January 1, 2021 | 515007000 | 1680000000 |
| Saturday, January 1, 2022 | 401575000 | 1766700000 |
| Sunday, January 1, 2023 | 496874000 | 2023700000 |
| Monday, January 1, 2024 | 2002600000 |
Unleashing insights
In the ever-evolving landscape of corporate America, understanding operational costs is crucial. This analysis delves into the Selling, General, and Administrative (SG&A) expenses of two industry giants: Axon Enterprise, Inc. and Rockwell Automation, Inc., from 2014 to 2023.
Axon has seen a remarkable increase in SG&A expenses, growing nearly tenfold from 2014 to 2023. This surge reflects Axon's aggressive expansion and investment in innovation. Notably, 2021 marked a peak with expenses reaching 515 million, a staggering 850% increase from 2014.
In contrast, Rockwell Automation's SG&A expenses have remained relatively stable, with a modest 29% increase over the same period. The company's strategic focus on efficiency and steady growth is evident, with 2023 expenses at 2 billion.
This comparison highlights the diverse strategies of these companies, offering insights into their operational priorities and market positioning.
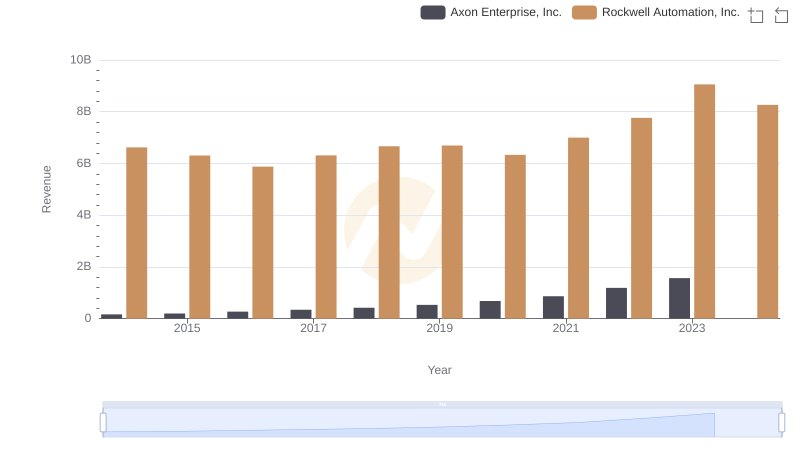
Axon Enterprise, Inc. vs Rockwell Automation, Inc.: Annual Revenue Growth Compared
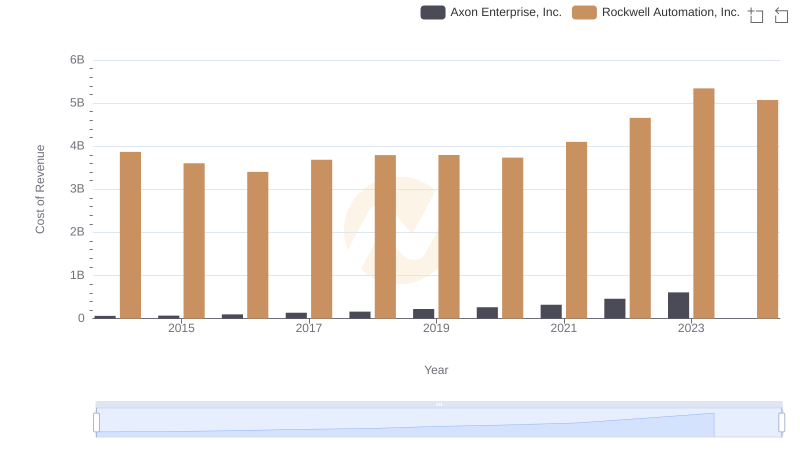
Cost of Revenue Comparison: Axon Enterprise, Inc. vs Rockwell Automation, Inc.
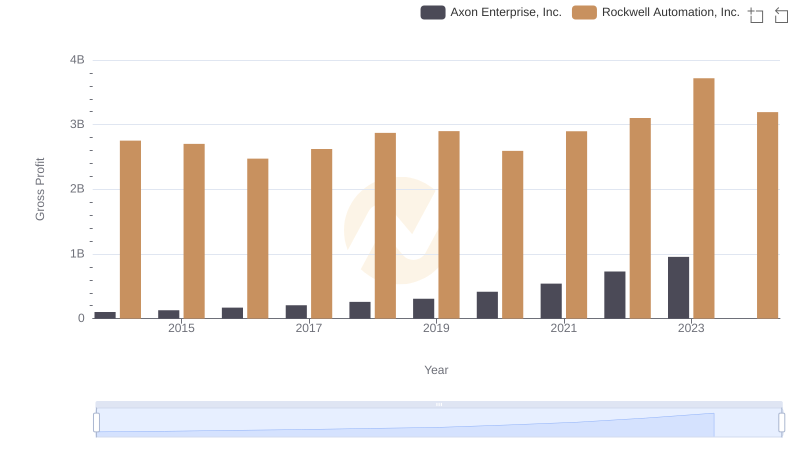
Axon Enterprise, Inc. and Rockwell Automation, Inc.: A Detailed Gross Profit Analysis
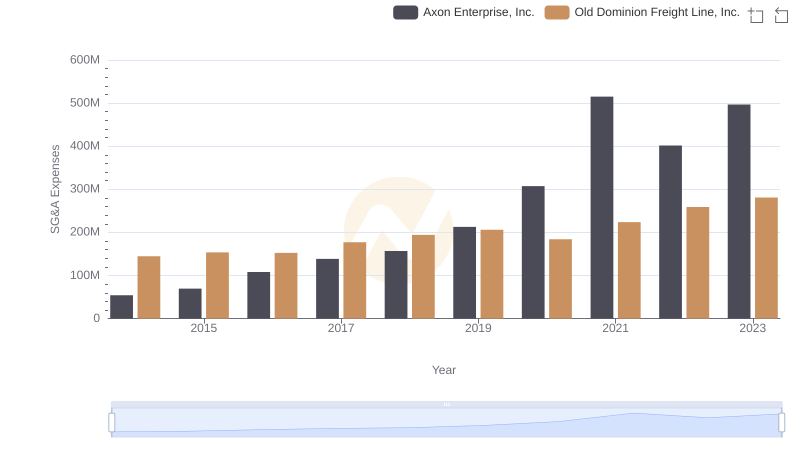
Breaking Down SG&A Expenses: Axon Enterprise, Inc. vs Old Dominion Freight Line, Inc.
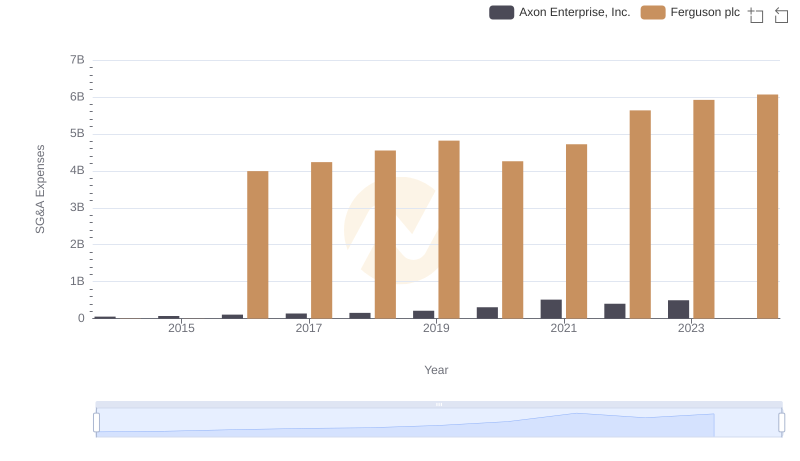
Axon Enterprise, Inc. or Ferguson plc: Who Manages SG&A Costs Better?
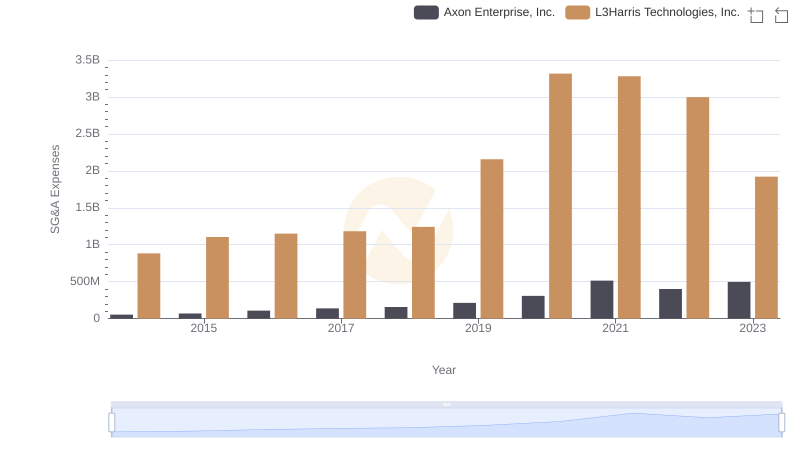
Selling, General, and Administrative Costs: Axon Enterprise, Inc. vs L3Harris Technologies, Inc.
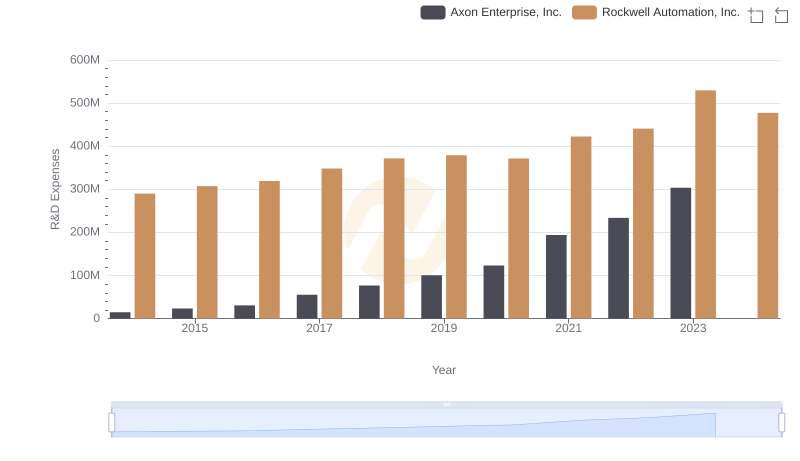
Research and Development: Comparing Key Metrics for Axon Enterprise, Inc. and Rockwell Automation, Inc.
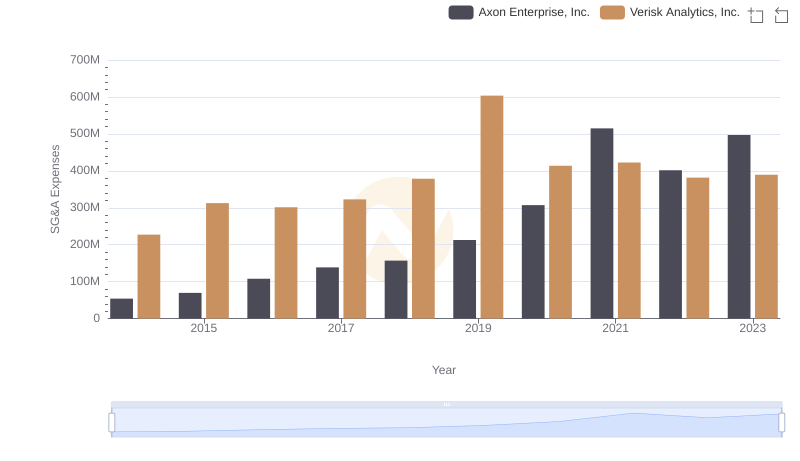
Axon Enterprise, Inc. vs Verisk Analytics, Inc.: SG&A Expense Trends
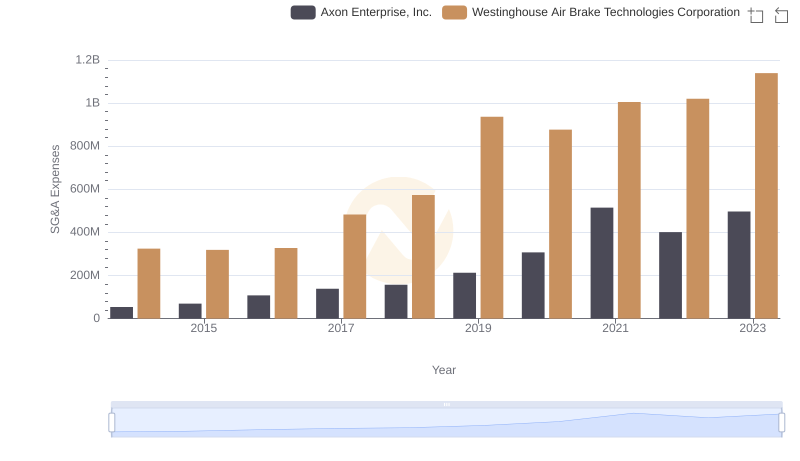
Selling, General, and Administrative Costs: Axon Enterprise, Inc. vs Westinghouse Air Brake Technologies Corporation
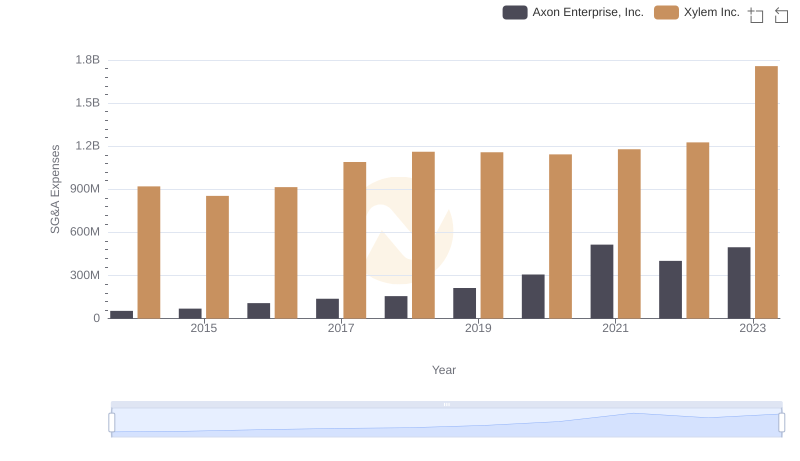
Axon Enterprise, Inc. vs Xylem Inc.: SG&A Expense Trends