| __timestamp | Axon Enterprise, Inc. | Xylem Inc. |
|---|---|---|
| Wednesday, January 1, 2014 | 54158000 | 920000000 |
| Thursday, January 1, 2015 | 69698000 | 854000000 |
| Friday, January 1, 2016 | 108076000 | 915000000 |
| Sunday, January 1, 2017 | 138692000 | 1090000000 |
| Monday, January 1, 2018 | 156886000 | 1161000000 |
| Tuesday, January 1, 2019 | 212959000 | 1158000000 |
| Wednesday, January 1, 2020 | 307286000 | 1143000000 |
| Friday, January 1, 2021 | 515007000 | 1179000000 |
| Saturday, January 1, 2022 | 401575000 | 1227000000 |
| Sunday, January 1, 2023 | 496874000 | 1757000000 |
Igniting the spark of knowledge
In the ever-evolving landscape of corporate finance, understanding the trends in Selling, General, and Administrative (SG&A) expenses is crucial for investors and analysts alike. Over the past decade, Axon Enterprise, Inc. and Xylem Inc. have showcased distinct trajectories in their SG&A expenditures. From 2014 to 2023, Axon Enterprise, Inc. saw a staggering increase of over 800% in their SG&A expenses, reflecting their aggressive growth and expansion strategies. In contrast, Xylem Inc.'s SG&A expenses grew by approximately 90%, indicating a more stable and consistent approach to managing operational costs. Notably, in 2023, Xylem Inc.'s SG&A expenses peaked at nearly 1.76 billion, dwarfing Axon's 497 million. These trends highlight the differing strategic priorities and market positions of these two industry players, offering valuable insights for stakeholders looking to understand their financial health and operational efficiency.
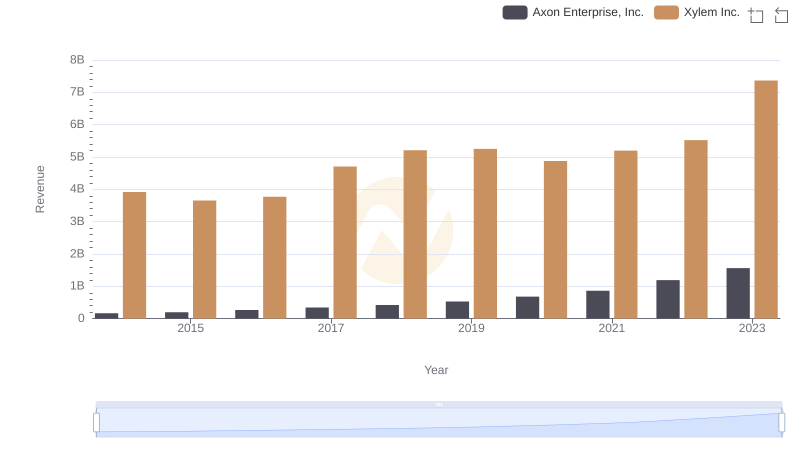
Axon Enterprise, Inc. or Xylem Inc.: Who Leads in Yearly Revenue?
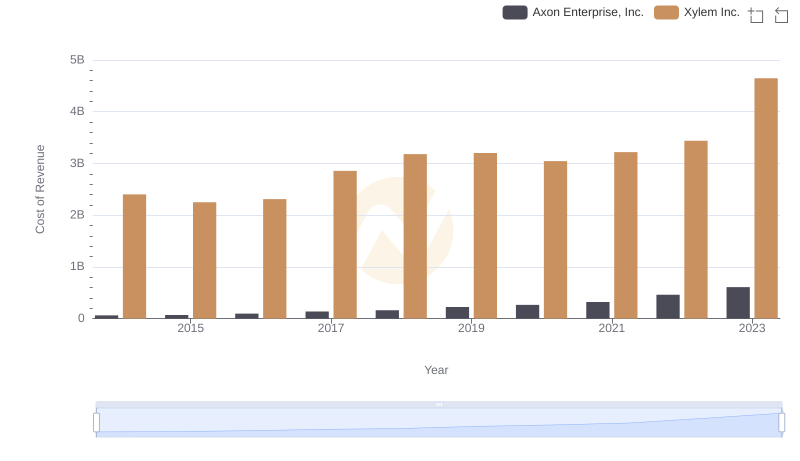
Comparing Cost of Revenue Efficiency: Axon Enterprise, Inc. vs Xylem Inc.
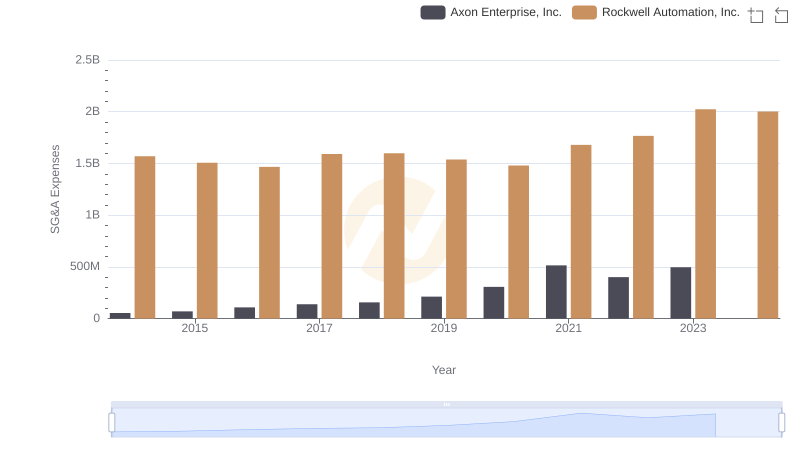
Operational Costs Compared: SG&A Analysis of Axon Enterprise, Inc. and Rockwell Automation, Inc.
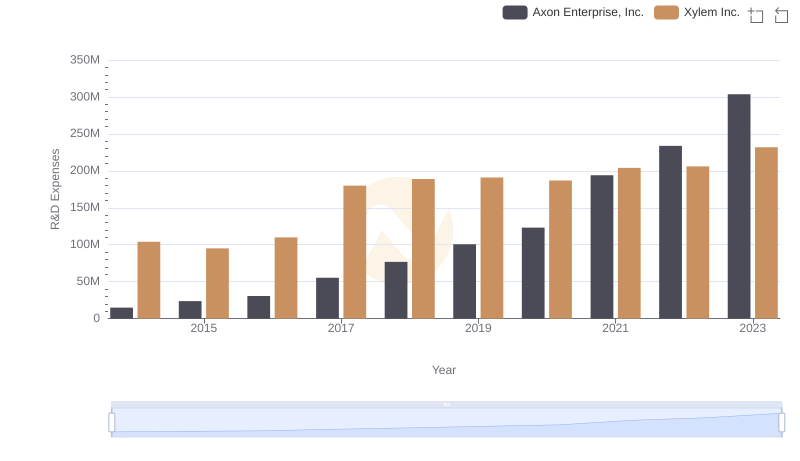
Research and Development: Comparing Key Metrics for Axon Enterprise, Inc. and Xylem Inc.
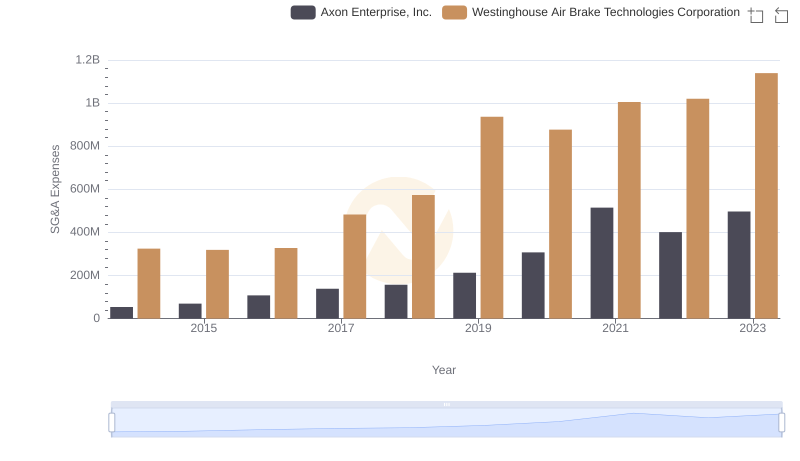
Selling, General, and Administrative Costs: Axon Enterprise, Inc. vs Westinghouse Air Brake Technologies Corporation
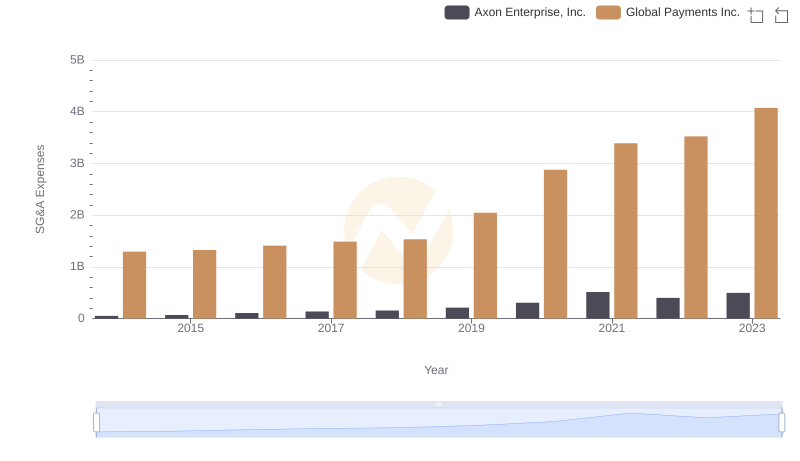
Breaking Down SG&A Expenses: Axon Enterprise, Inc. vs Global Payments Inc.
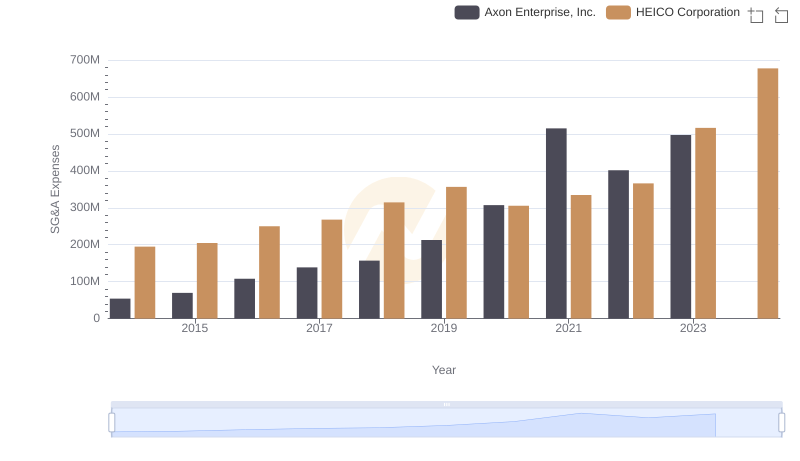
Operational Costs Compared: SG&A Analysis of Axon Enterprise, Inc. and HEICO Corporation
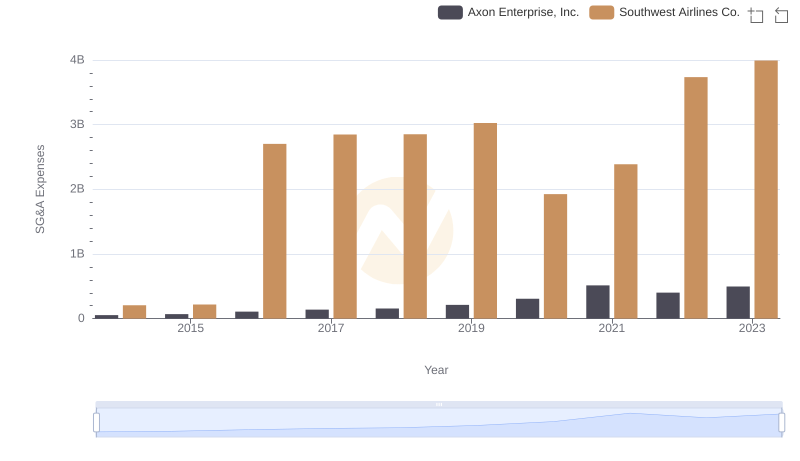
Who Optimizes SG&A Costs Better? Axon Enterprise, Inc. or Southwest Airlines Co.
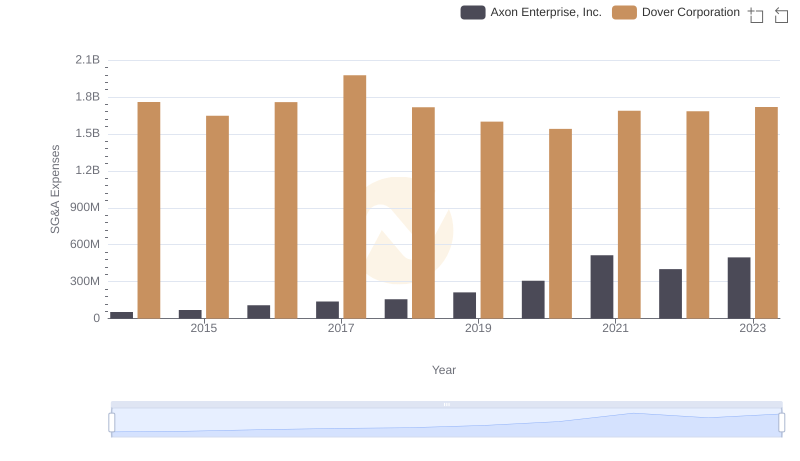
Selling, General, and Administrative Costs: Axon Enterprise, Inc. vs Dover Corporation
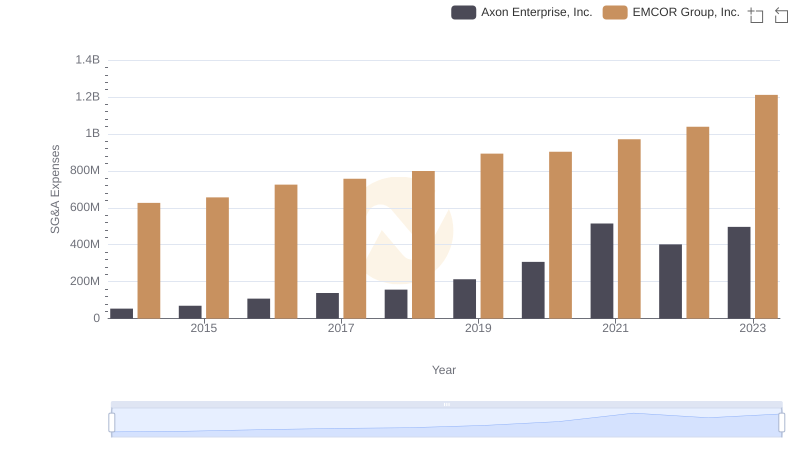
SG&A Efficiency Analysis: Comparing Axon Enterprise, Inc. and EMCOR Group, Inc.