| __timestamp | Axon Enterprise, Inc. | Global Payments Inc. |
|---|---|---|
| Wednesday, January 1, 2014 | 101548000 | 1751611000 |
| Thursday, January 1, 2015 | 128647000 | 1750511000 |
| Friday, January 1, 2016 | 170536000 | 1767444000 |
| Sunday, January 1, 2017 | 207088000 | 2047126000 |
| Monday, January 1, 2018 | 258583000 | 2271352000 |
| Tuesday, January 1, 2019 | 307286000 | 2838089000 |
| Wednesday, January 1, 2020 | 416331000 | 3772831000 |
| Friday, January 1, 2021 | 540910000 | 4750037000 |
| Saturday, January 1, 2022 | 728638000 | 5196898000 |
| Sunday, January 1, 2023 | 955382000 | 5926898000 |
| Monday, January 1, 2024 | 6345778000 |
Igniting the spark of knowledge
In the ever-evolving landscape of the financial sector, understanding the growth trajectory of companies is crucial. From 2014 to 2023, Axon Enterprise, Inc. and Global Payments Inc. have demonstrated remarkable growth in their gross profits. Axon Enterprise, Inc. has seen an impressive increase of over 840%, starting from a modest $101 million in 2014 to nearly $956 million in 2023. This growth reflects the company's strategic expansion and innovation in public safety technology.
Meanwhile, Global Payments Inc. has maintained a robust growth trajectory, with its gross profit rising by approximately 240% over the same period, reaching nearly $5.93 billion in 2023. This growth underscores the company's stronghold in the payment technology sector, driven by its global reach and diversified services. The data highlights the dynamic nature of these industries and the companies' ability to adapt and thrive.
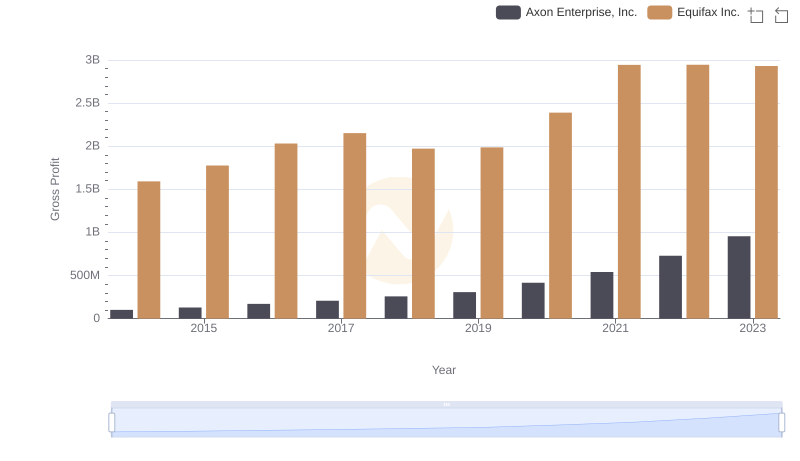
Who Generates Higher Gross Profit? Axon Enterprise, Inc. or Equifax Inc.
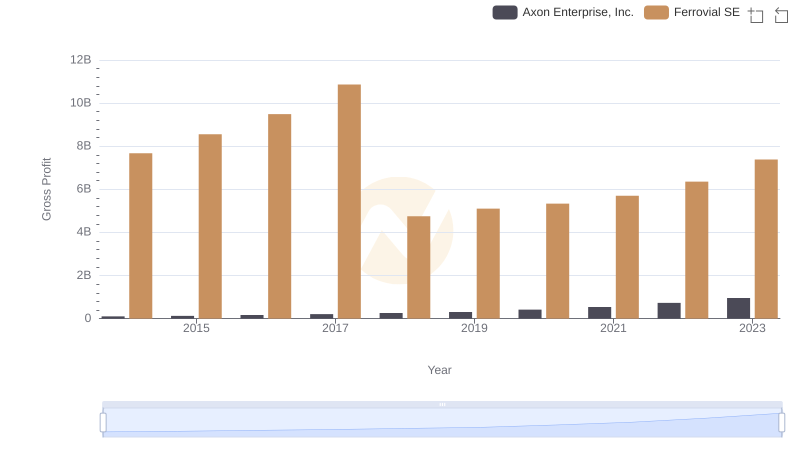
Axon Enterprise, Inc. vs Ferrovial SE: A Gross Profit Performance Breakdown
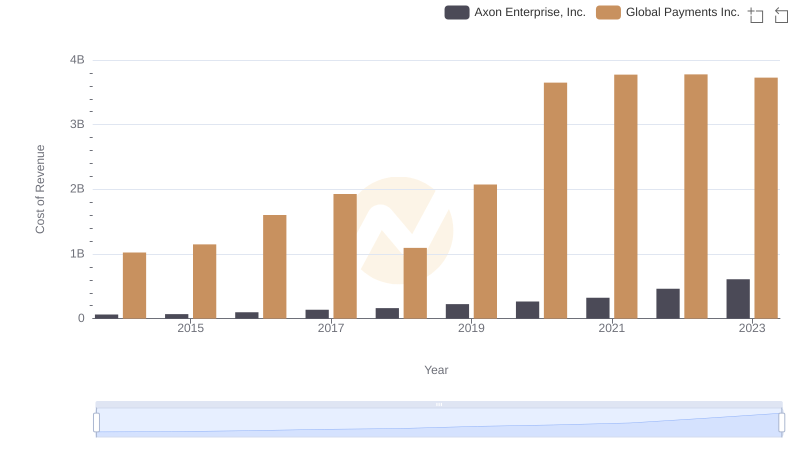
Cost Insights: Breaking Down Axon Enterprise, Inc. and Global Payments Inc.'s Expenses
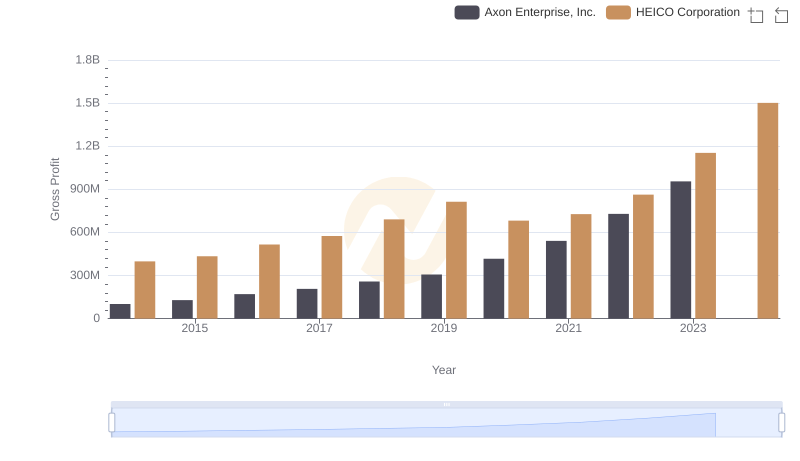
Gross Profit Analysis: Comparing Axon Enterprise, Inc. and HEICO Corporation
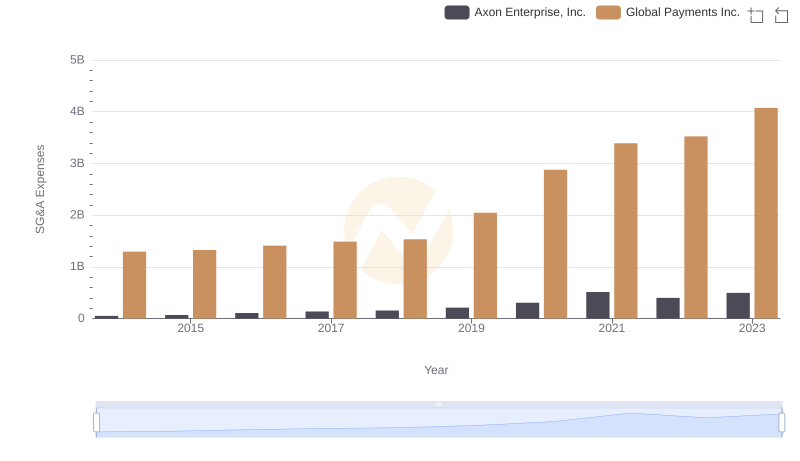
Breaking Down SG&A Expenses: Axon Enterprise, Inc. vs Global Payments Inc.
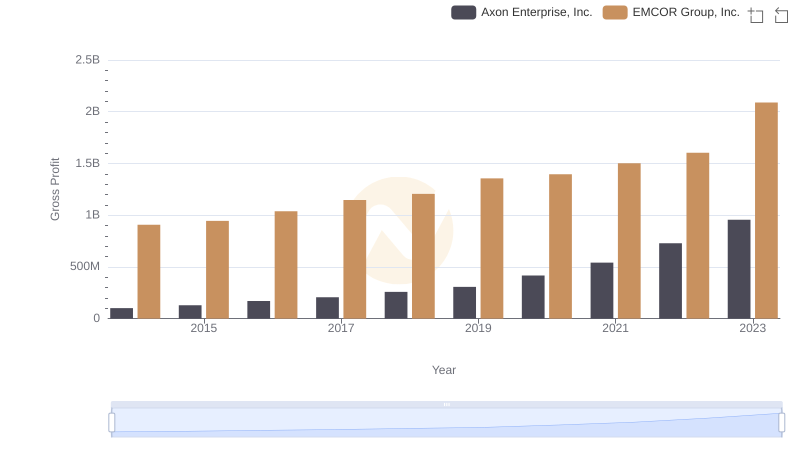
Key Insights on Gross Profit: Axon Enterprise, Inc. vs EMCOR Group, Inc.
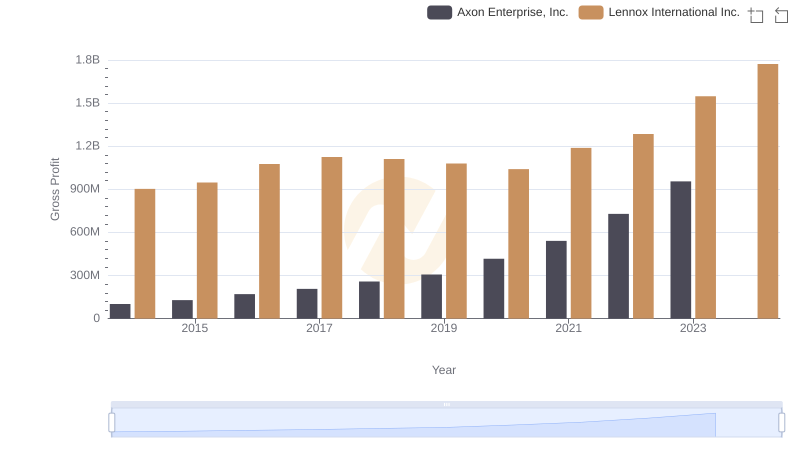
Gross Profit Analysis: Comparing Axon Enterprise, Inc. and Lennox International Inc.
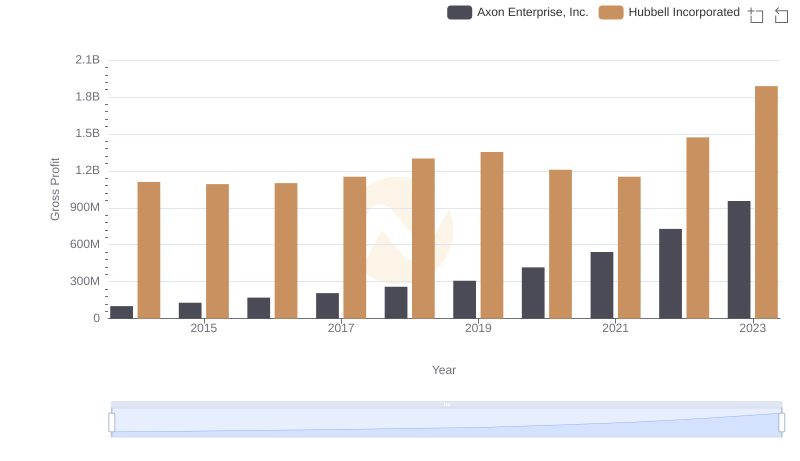
Key Insights on Gross Profit: Axon Enterprise, Inc. vs Hubbell Incorporated