| __timestamp | Clean Harbors, Inc. | United Rentals, Inc. |
|---|---|---|
| Wednesday, January 1, 2014 | 3401636000 | 5685000000 |
| Thursday, January 1, 2015 | 3275137000 | 5817000000 |
| Friday, January 1, 2016 | 2755226000 | 5762000000 |
| Sunday, January 1, 2017 | 2944978000 | 6641000000 |
| Monday, January 1, 2018 | 3300303000 | 8047000000 |
| Tuesday, January 1, 2019 | 3412190000 | 9351000000 |
| Wednesday, January 1, 2020 | 3144097000 | 8530000000 |
| Friday, January 1, 2021 | 3805566000 | 9716000000 |
| Saturday, January 1, 2022 | 5166605000 | 11642000000 |
| Sunday, January 1, 2023 | 5409152000 | 14332000000 |
| Monday, January 1, 2024 | 5889952000 | 15345000000 |
Cracking the code
In the competitive landscape of industrial services, United Rentals, Inc. and Clean Harbors, Inc. have showcased intriguing revenue trajectories over the past decade. Since 2014, United Rentals has consistently outpaced Clean Harbors, with a remarkable 170% increase in revenue by 2023. This growth trajectory highlights United Rentals' strategic expansions and market adaptability. Meanwhile, Clean Harbors has demonstrated a steady growth pattern, achieving a 60% increase in revenue over the same period, reflecting its resilience and niche market focus.
The data for 2024 is incomplete, suggesting potential for further analysis as new figures emerge.
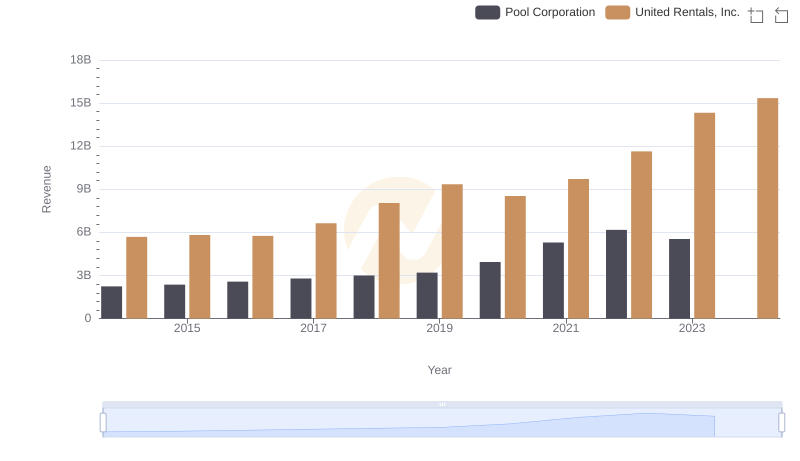
Annual Revenue Comparison: United Rentals, Inc. vs Pool Corporation

Breaking Down Revenue Trends: United Rentals, Inc. vs Saia, Inc.
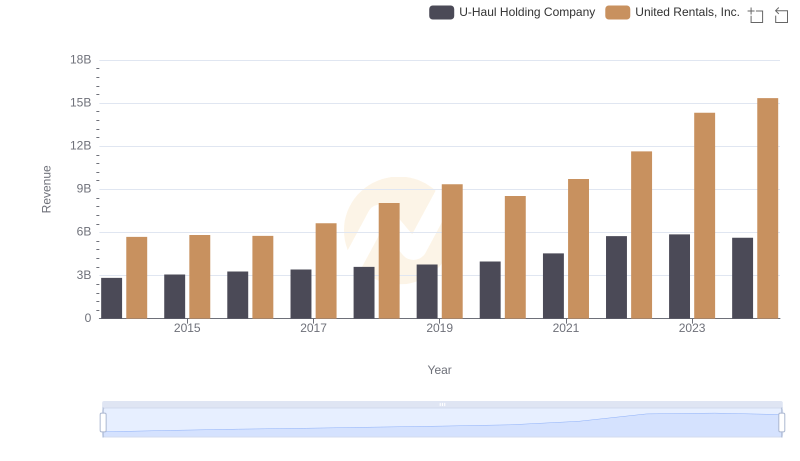
Revenue Showdown: United Rentals, Inc. vs U-Haul Holding Company
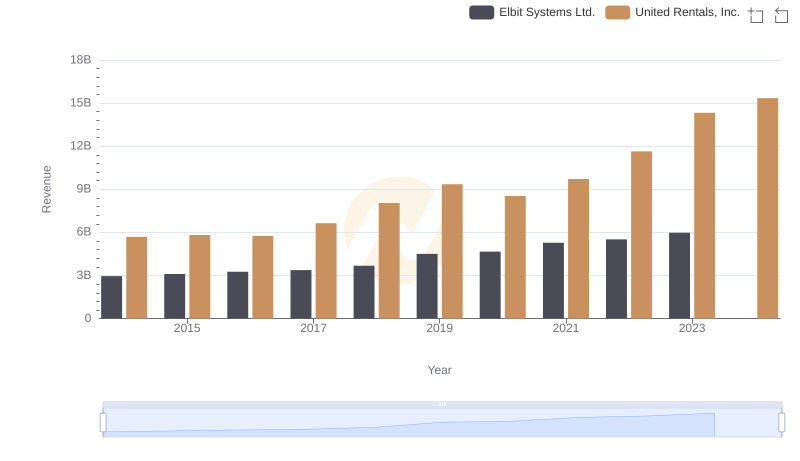
Breaking Down Revenue Trends: United Rentals, Inc. vs Elbit Systems Ltd.
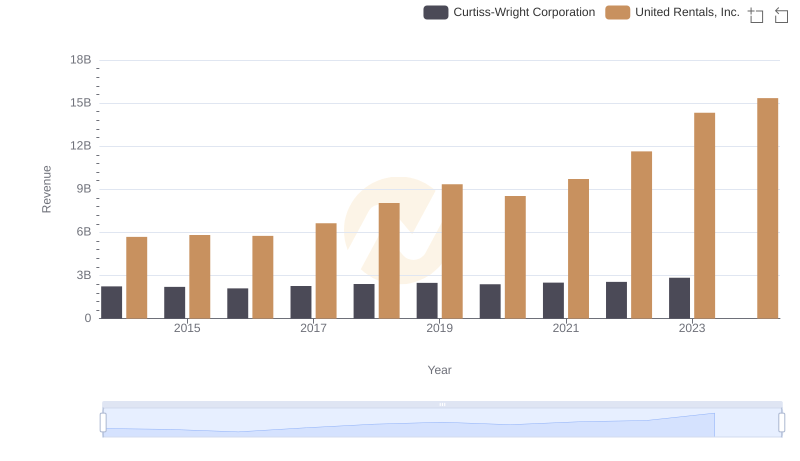
Who Generates More Revenue? United Rentals, Inc. or Curtiss-Wright Corporation
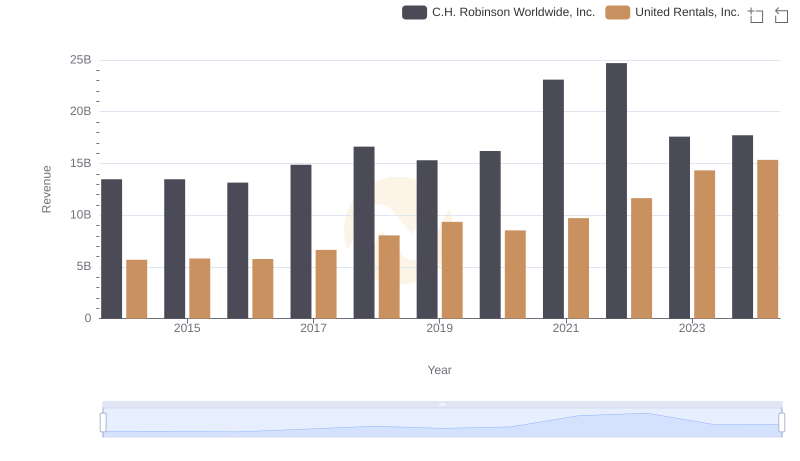
United Rentals, Inc. vs C.H. Robinson Worldwide, Inc.: Examining Key Revenue Metrics
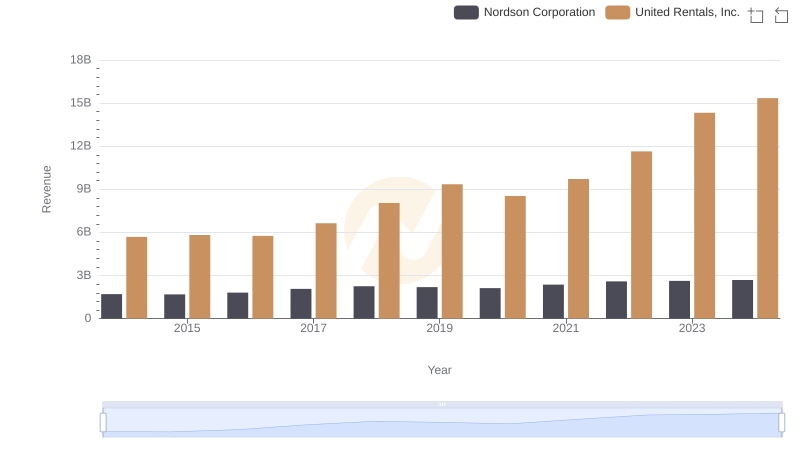
Revenue Showdown: United Rentals, Inc. vs Nordson Corporation
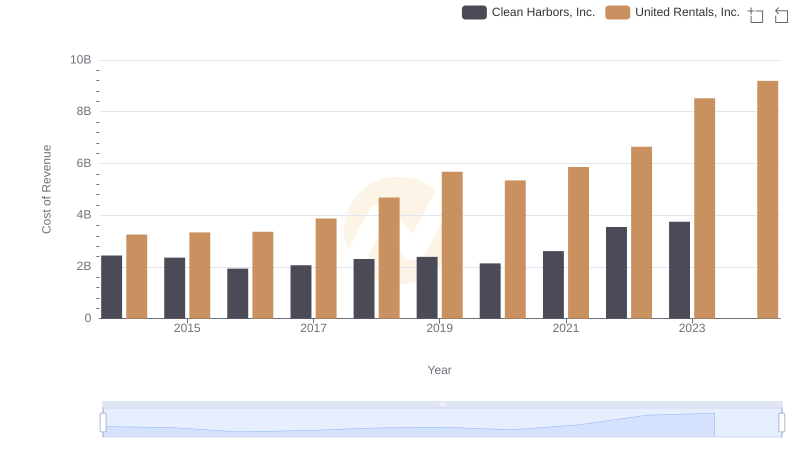
Cost of Revenue: Key Insights for United Rentals, Inc. and Clean Harbors, Inc.
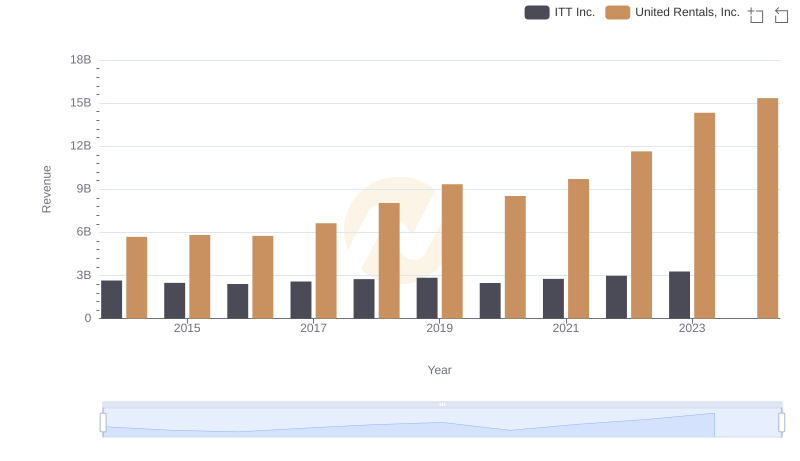
United Rentals, Inc. vs ITT Inc.: Annual Revenue Growth Compared
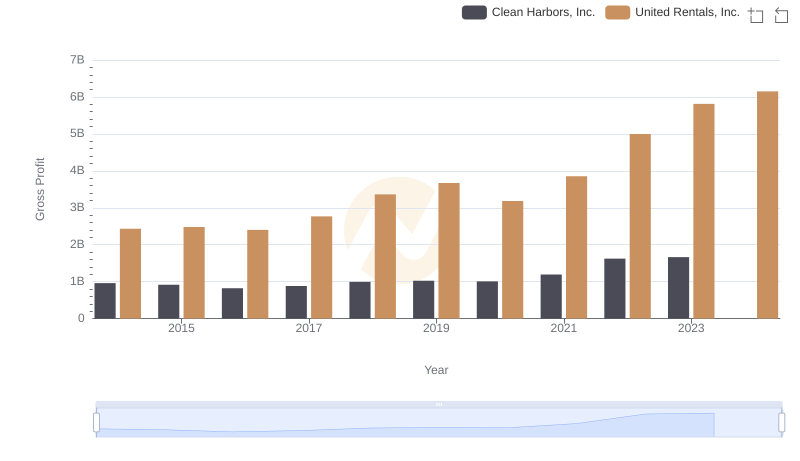
United Rentals, Inc. and Clean Harbors, Inc.: A Detailed Gross Profit Analysis
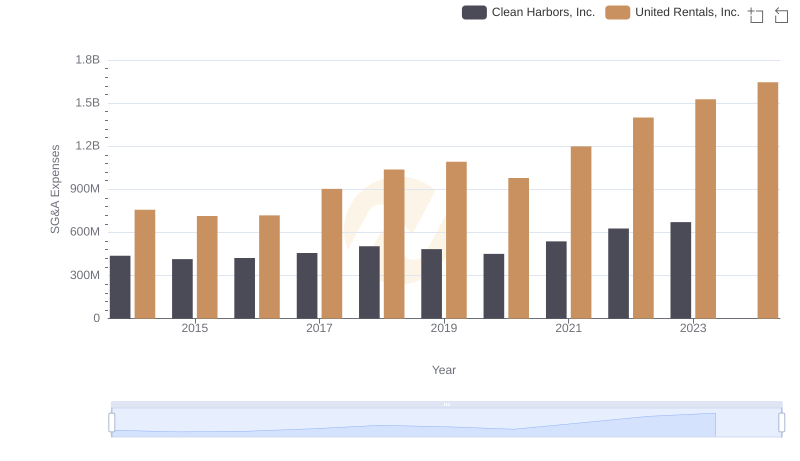
Operational Costs Compared: SG&A Analysis of United Rentals, Inc. and Clean Harbors, Inc.