| __timestamp | Union Pacific Corporation | W.W. Grainger, Inc. |
|---|---|---|
| Wednesday, January 1, 2014 | 9677000000 | 4314242000 |
| Thursday, January 1, 2015 | 8976000000 | 4231428000 |
| Friday, January 1, 2016 | 8269000000 | 4114557000 |
| Sunday, January 1, 2017 | 9009000000 | 4097557000 |
| Monday, January 1, 2018 | 9539000000 | 4348000000 |
| Tuesday, January 1, 2019 | 9614000000 | 4397000000 |
| Wednesday, January 1, 2020 | 9179000000 | 4238000000 |
| Friday, January 1, 2021 | 10514000000 | 4720000000 |
| Saturday, January 1, 2022 | 11205000000 | 5849000000 |
| Sunday, January 1, 2023 | 10529000000 | 6496000000 |
| Monday, January 1, 2024 | 11039000000 | 6758000000 |
Unlocking the unknown
In the ever-evolving landscape of American industry, Union Pacific Corporation and W.W. Grainger, Inc. stand as titans of their respective fields. Over the past decade, Union Pacific has consistently demonstrated robust growth, with its gross profit surging by approximately 33% from 2014 to 2023. This growth underscores its dominance in the transportation sector, driven by strategic expansions and operational efficiencies.
Conversely, W.W. Grainger, a leader in industrial supply, has shown a steady upward trajectory, with a remarkable 50% increase in gross profit over the same period. This growth reflects its adaptability and resilience in meeting the diverse needs of its clientele.
While Union Pacific's data for 2024 is promising, W.W. Grainger's figures remain elusive, leaving room for speculation. As these giants continue to shape their industries, their financial narratives offer valuable insights into the broader economic landscape.
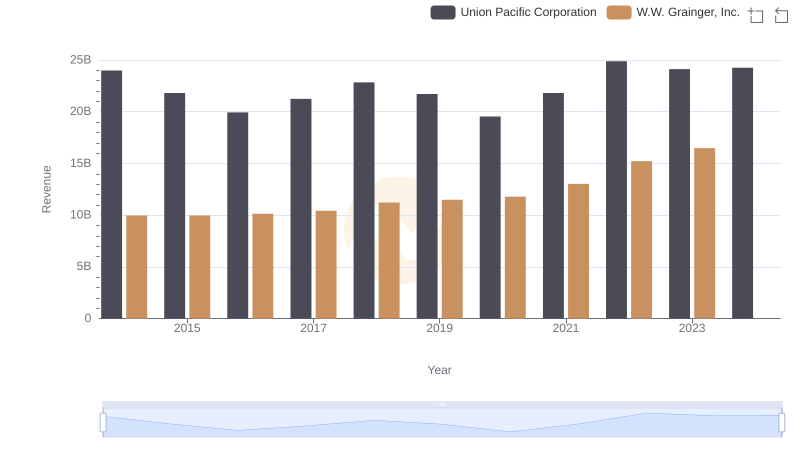
Breaking Down Revenue Trends: Union Pacific Corporation vs W.W. Grainger, Inc.
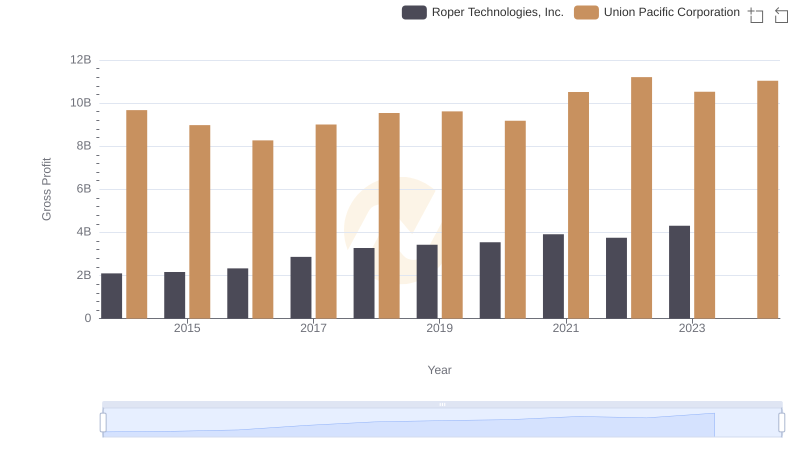
Who Generates Higher Gross Profit? Union Pacific Corporation or Roper Technologies, Inc.
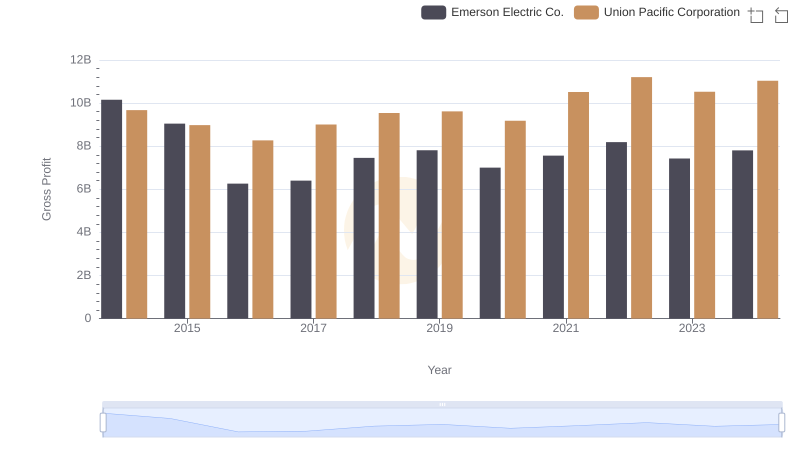
Union Pacific Corporation and Emerson Electric Co.: A Detailed Gross Profit Analysis
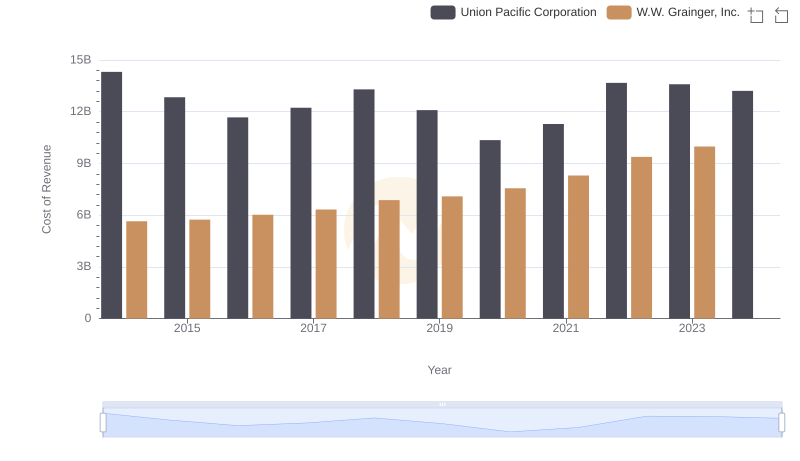
Analyzing Cost of Revenue: Union Pacific Corporation and W.W. Grainger, Inc.
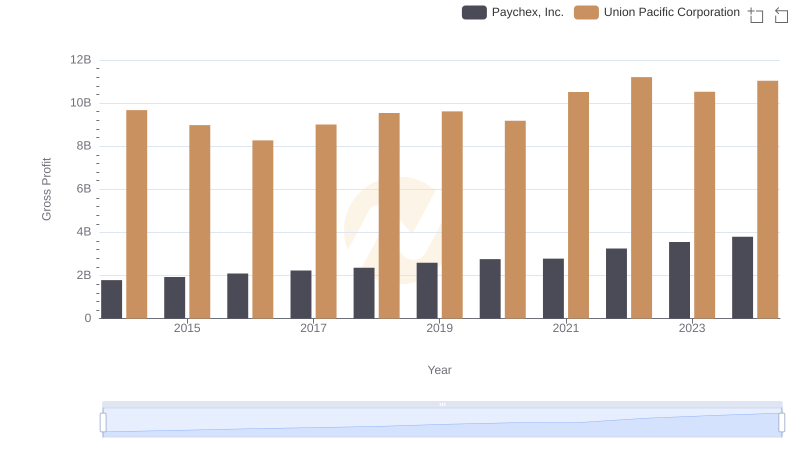
Gross Profit Analysis: Comparing Union Pacific Corporation and Paychex, Inc.