| __timestamp | Axon Enterprise, Inc. | Xylem Inc. |
|---|---|---|
| Wednesday, January 1, 2014 | 62977000 | 2403000000 |
| Thursday, January 1, 2015 | 69245000 | 2249000000 |
| Friday, January 1, 2016 | 97709000 | 2310000000 |
| Sunday, January 1, 2017 | 136710000 | 2856000000 |
| Monday, January 1, 2018 | 161485000 | 3181000000 |
| Tuesday, January 1, 2019 | 223574000 | 3203000000 |
| Wednesday, January 1, 2020 | 264672000 | 3046000000 |
| Friday, January 1, 2021 | 322471000 | 3220000000 |
| Saturday, January 1, 2022 | 461297000 | 3438000000 |
| Sunday, January 1, 2023 | 608009000 | 4647000000 |
Unlocking the unknown
In the ever-evolving landscape of corporate efficiency, the cost of revenue is a critical metric. Over the past decade, Axon Enterprise, Inc. and Xylem Inc. have showcased contrasting trajectories in this domain. From 2014 to 2023, Axon Enterprise, Inc. has seen its cost of revenue grow nearly tenfold, reflecting a dynamic expansion strategy. In contrast, Xylem Inc.'s cost of revenue has increased by approximately 93%, indicating a more stable growth pattern.
This comparison underscores the diverse strategies and market dynamics influencing these industry leaders.
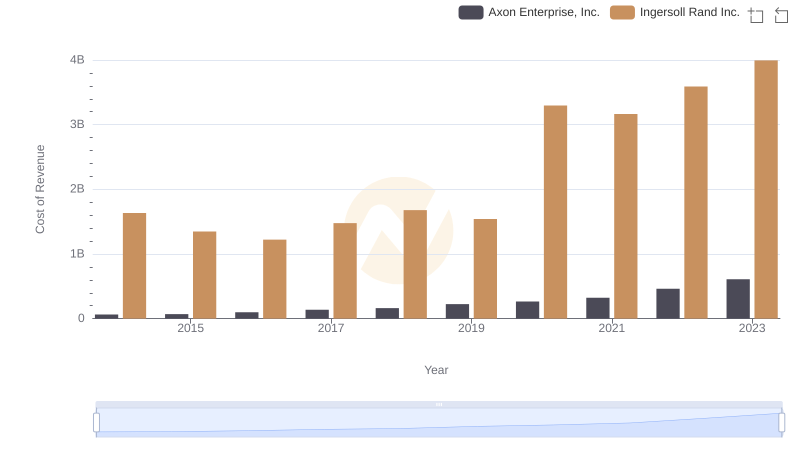
Analyzing Cost of Revenue: Axon Enterprise, Inc. and Ingersoll Rand Inc.
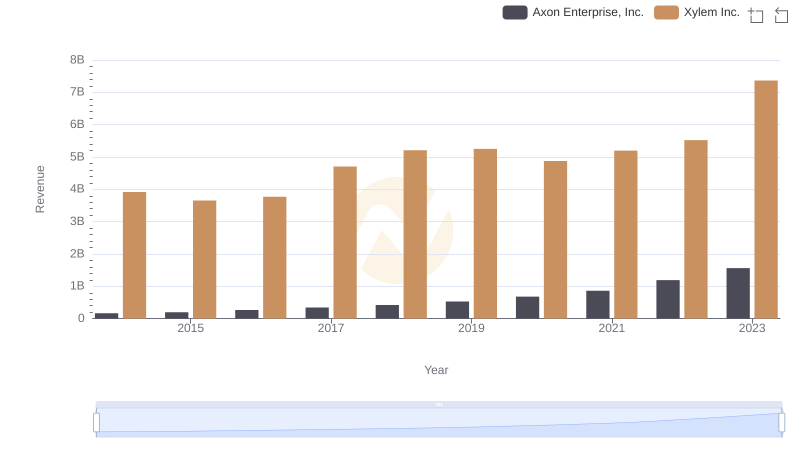
Axon Enterprise, Inc. or Xylem Inc.: Who Leads in Yearly Revenue?
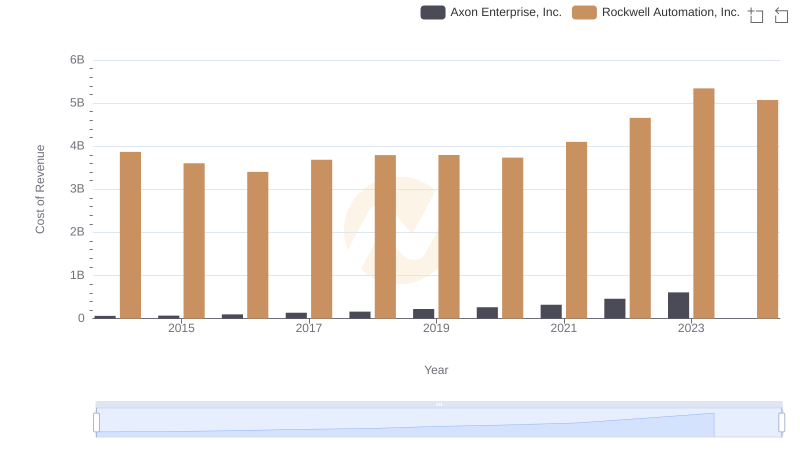
Cost of Revenue Comparison: Axon Enterprise, Inc. vs Rockwell Automation, Inc.
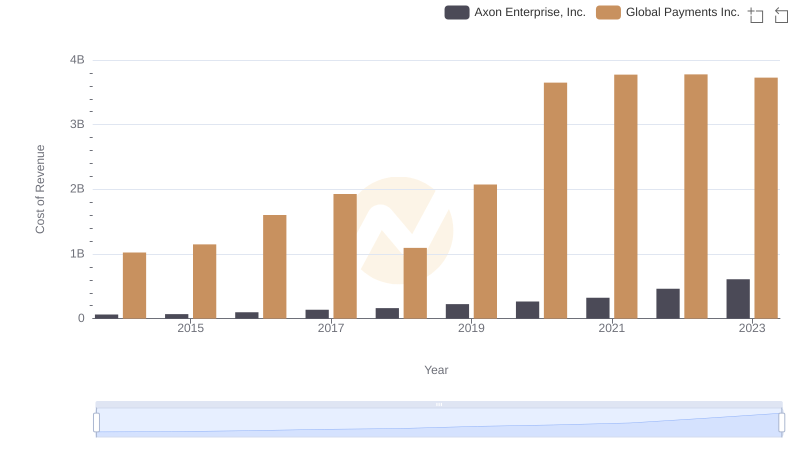
Cost Insights: Breaking Down Axon Enterprise, Inc. and Global Payments Inc.'s Expenses
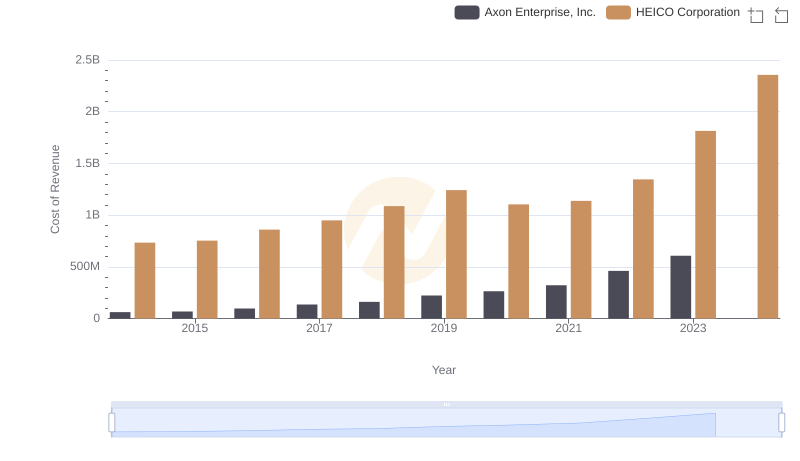
Cost of Revenue Trends: Axon Enterprise, Inc. vs HEICO Corporation
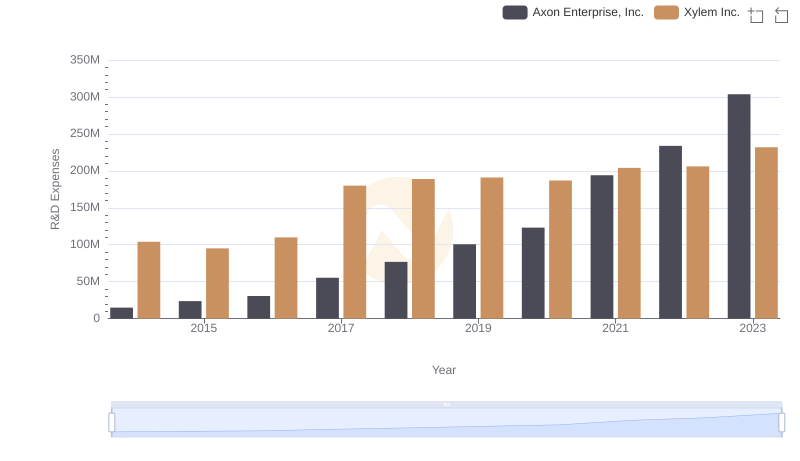
Research and Development: Comparing Key Metrics for Axon Enterprise, Inc. and Xylem Inc.
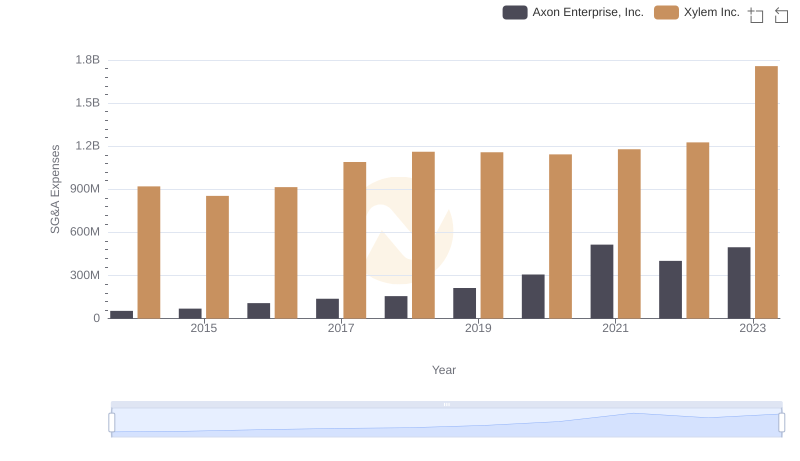
Axon Enterprise, Inc. vs Xylem Inc.: SG&A Expense Trends