| __timestamp | Axon Enterprise, Inc. | ITT Inc. |
|---|---|---|
| Wednesday, January 1, 2014 | 101548000 | 866400000 |
| Thursday, January 1, 2015 | 128647000 | 809100000 |
| Friday, January 1, 2016 | 170536000 | 758200000 |
| Sunday, January 1, 2017 | 207088000 | 817200000 |
| Monday, January 1, 2018 | 258583000 | 887200000 |
| Tuesday, January 1, 2019 | 307286000 | 910100000 |
| Wednesday, January 1, 2020 | 416331000 | 782200000 |
| Friday, January 1, 2021 | 540910000 | 899500000 |
| Saturday, January 1, 2022 | 728638000 | 922300000 |
| Sunday, January 1, 2023 | 955382000 | 1107300000 |
| Monday, January 1, 2024 | 1247300000 |
Unleashing insights
In the ever-evolving landscape of the technology and manufacturing sectors, understanding financial performance is crucial. This analysis delves into the gross profit trends of Axon Enterprise, Inc. and ITT Inc. from 2014 to 2023. Over this period, Axon Enterprise, Inc. has demonstrated a remarkable growth trajectory, with its gross profit surging by approximately 840%, from $101 million in 2014 to nearly $956 million in 2023. In contrast, ITT Inc. has shown a steadier growth pattern, with a 28% increase, reaching over $1.1 billion in 2023. This comparison highlights Axon's aggressive expansion strategy, while ITT maintains a consistent, robust performance. Such insights are invaluable for investors and industry analysts seeking to understand market dynamics and company strategies. As the financial landscape continues to shift, these trends offer a glimpse into the future of these industry leaders.
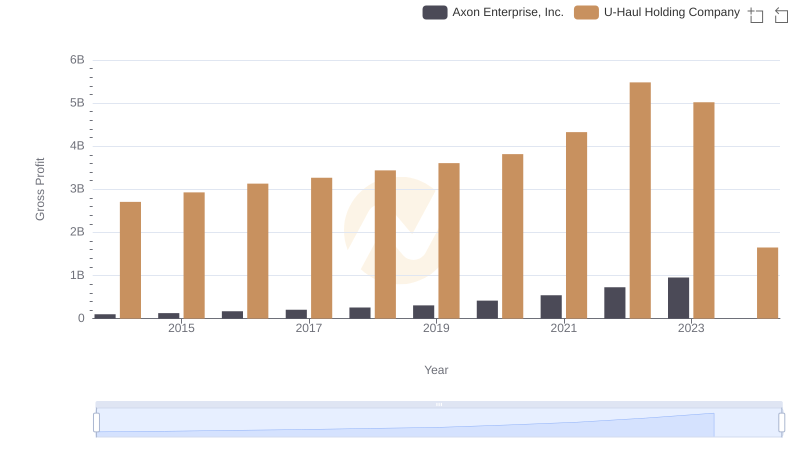
Gross Profit Analysis: Comparing Axon Enterprise, Inc. and U-Haul Holding Company
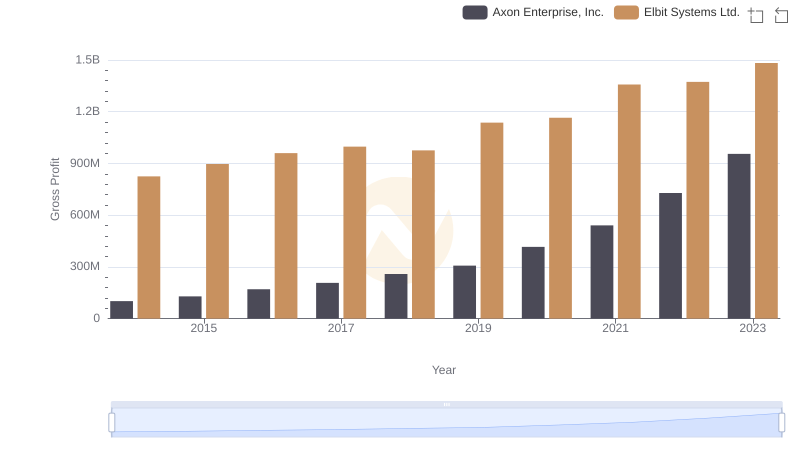
Gross Profit Analysis: Comparing Axon Enterprise, Inc. and Elbit Systems Ltd.
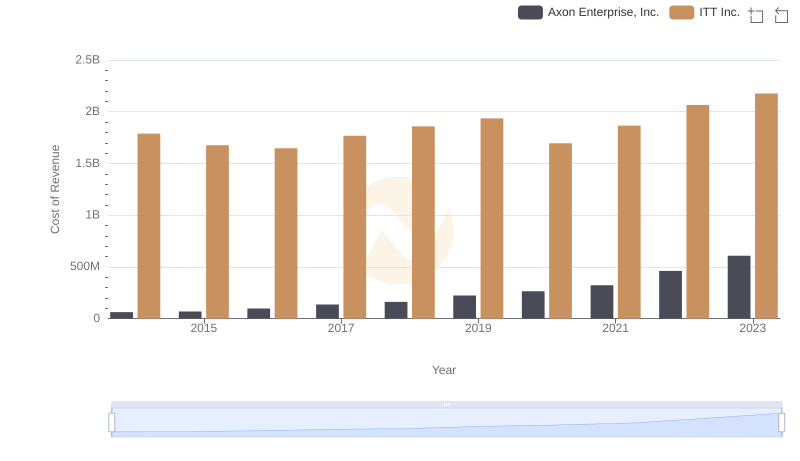
Analyzing Cost of Revenue: Axon Enterprise, Inc. and ITT Inc.
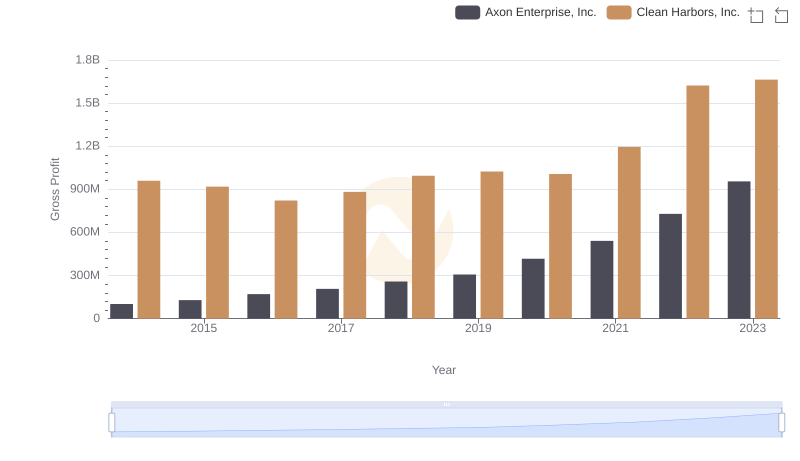
Key Insights on Gross Profit: Axon Enterprise, Inc. vs Clean Harbors, Inc.
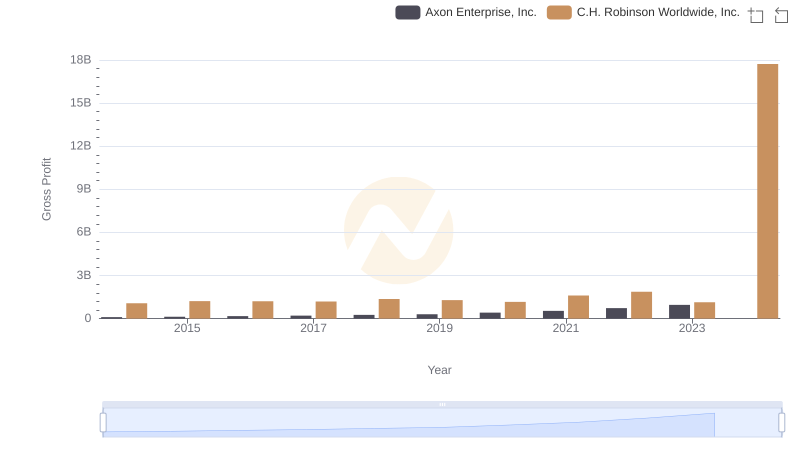
Gross Profit Trends Compared: Axon Enterprise, Inc. vs C.H. Robinson Worldwide, Inc.
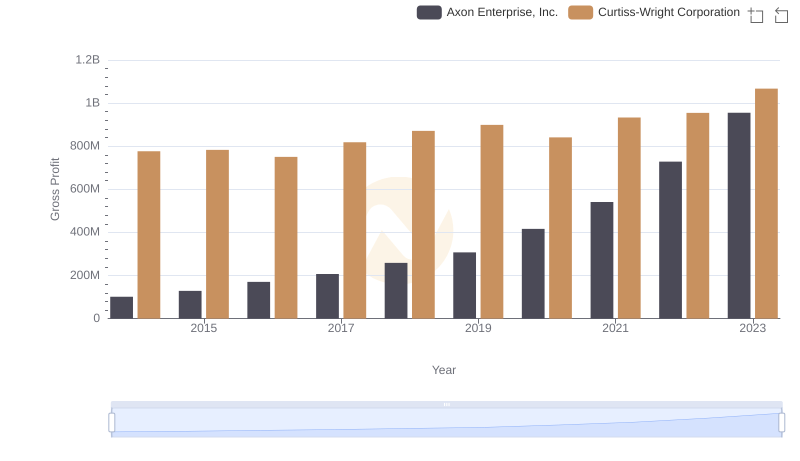
Gross Profit Trends Compared: Axon Enterprise, Inc. vs Curtiss-Wright Corporation
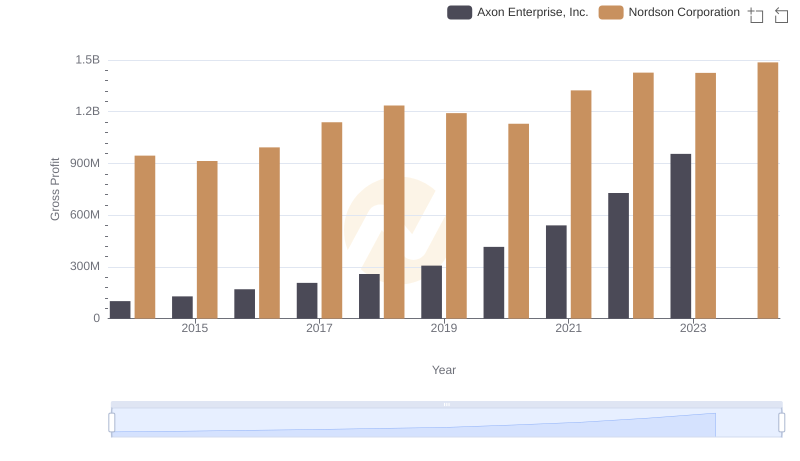
Axon Enterprise, Inc. vs Nordson Corporation: A Gross Profit Performance Breakdown
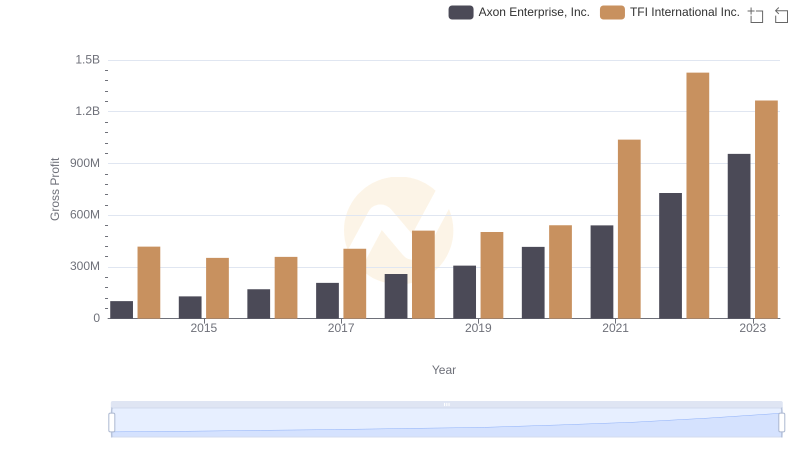
Key Insights on Gross Profit: Axon Enterprise, Inc. vs TFI International Inc.
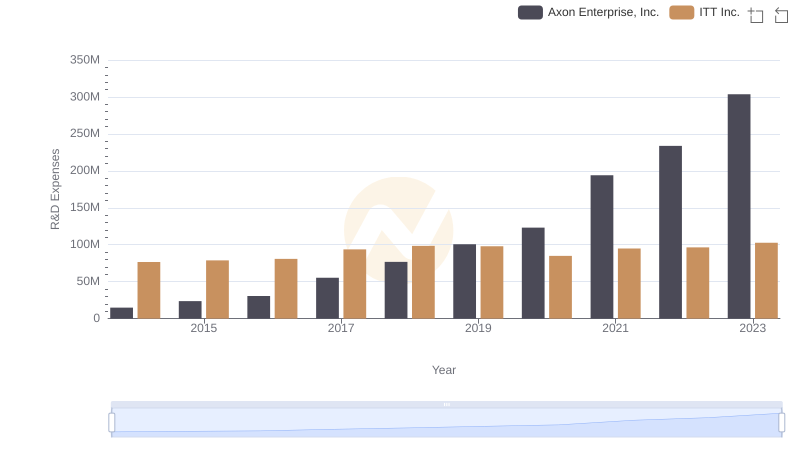
R&D Spending Showdown: Axon Enterprise, Inc. vs ITT Inc.
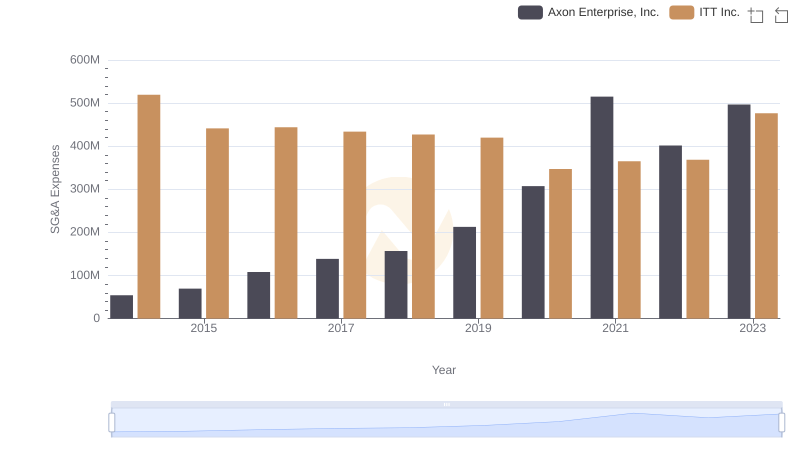
Axon Enterprise, Inc. vs ITT Inc.: SG&A Expense Trends