| __timestamp | Automatic Data Processing, Inc. | Nordson Corporation |
|---|---|---|
| Wednesday, January 1, 2014 | 2762400000 | 577993000 |
| Thursday, January 1, 2015 | 2496900000 | 596234000 |
| Friday, January 1, 2016 | 2637000000 | 605068000 |
| Sunday, January 1, 2017 | 2783200000 | 681299000 |
| Monday, January 1, 2018 | 2971500000 | 741408000 |
| Tuesday, January 1, 2019 | 3064200000 | 708990000 |
| Wednesday, January 1, 2020 | 3003000000 | 693552000 |
| Friday, January 1, 2021 | 3040500000 | 708953000 |
| Saturday, January 1, 2022 | 3233200000 | 724176000 |
| Sunday, January 1, 2023 | 3551400000 | 681244000 |
| Monday, January 1, 2024 | 3778900000 | 812128000 |
Infusing magic into the data realm
In the ever-evolving landscape of corporate finance, understanding the trends in Selling, General, and Administrative (SG&A) expenses is crucial for investors and analysts alike. Over the past decade, Automatic Data Processing, Inc. (ADP) and Nordson Corporation have showcased distinct trajectories in their SG&A expenditures.
From 2014 to 2024, ADP's SG&A expenses have surged by approximately 36%, reflecting a strategic expansion and investment in operational efficiencies. In contrast, Nordson Corporation's SG&A expenses have grown by about 40%, indicating a robust commitment to scaling its operations. Notably, ADP's expenses peaked in 2024, reaching nearly 3.7 billion, while Nordson's expenses also hit a high, surpassing 800 million.
These trends underscore the dynamic nature of corporate strategies and their impact on financial health, offering valuable insights for stakeholders aiming to navigate the complexities of the market.
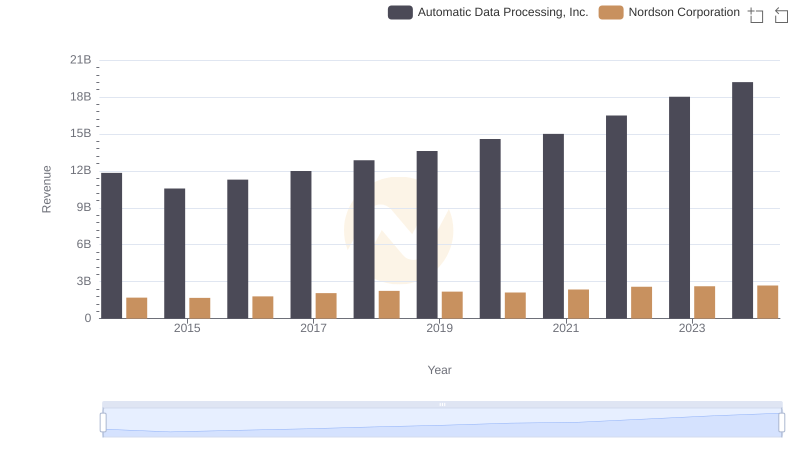
Who Generates More Revenue? Automatic Data Processing, Inc. or Nordson Corporation
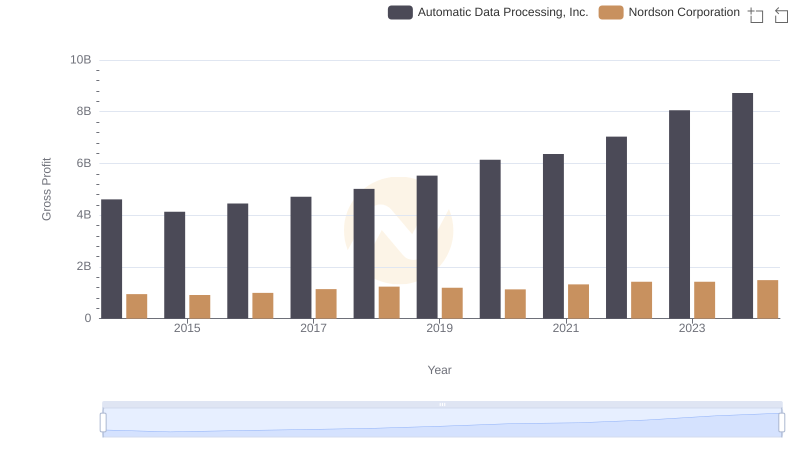
Gross Profit Trends Compared: Automatic Data Processing, Inc. vs Nordson Corporation

Operational Costs Compared: SG&A Analysis of Automatic Data Processing, Inc. and U-Haul Holding Company
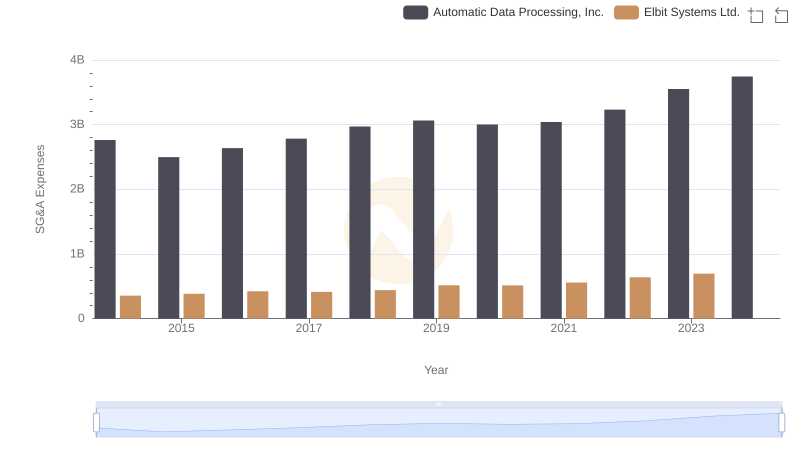
Operational Costs Compared: SG&A Analysis of Automatic Data Processing, Inc. and Elbit Systems Ltd.

Who Optimizes SG&A Costs Better? Automatic Data Processing, Inc. or C.H. Robinson Worldwide, Inc.
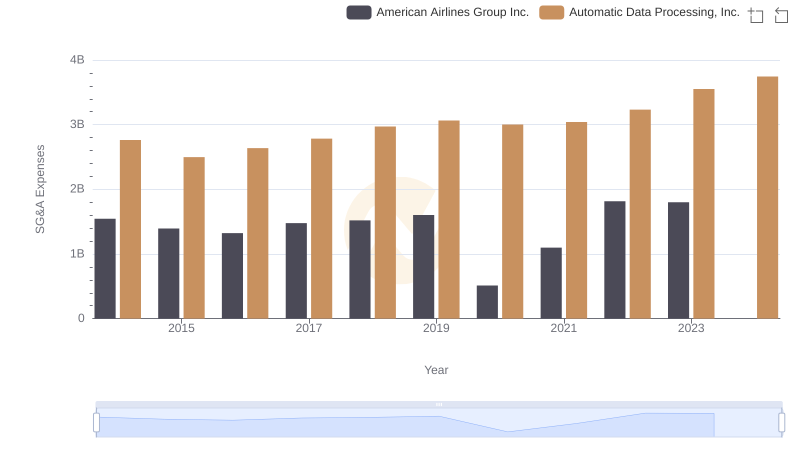
SG&A Efficiency Analysis: Comparing Automatic Data Processing, Inc. and American Airlines Group Inc.
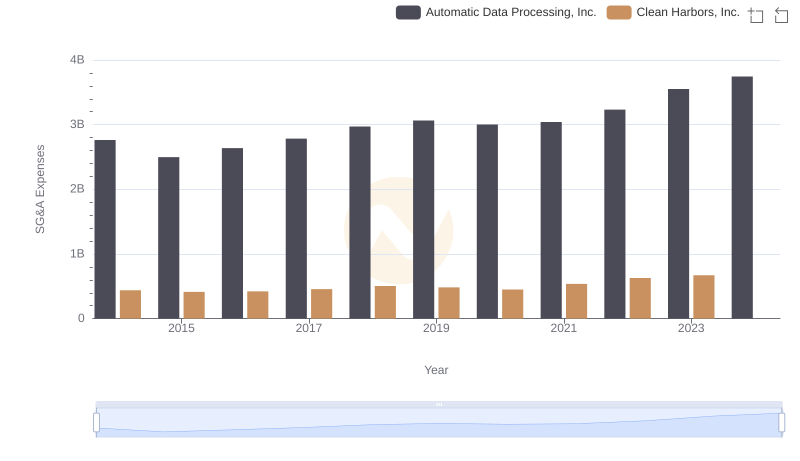
Automatic Data Processing, Inc. and Clean Harbors, Inc.: SG&A Spending Patterns Compared

Automatic Data Processing, Inc. vs Nordson Corporation: In-Depth EBITDA Performance Comparison

Operational Costs Compared: SG&A Analysis of Automatic Data Processing, Inc. and Allegion plc
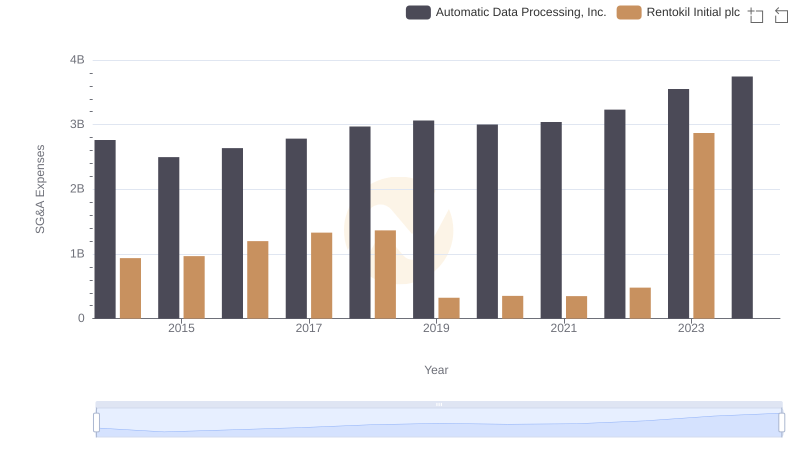
Operational Costs Compared: SG&A Analysis of Automatic Data Processing, Inc. and Rentokil Initial plc
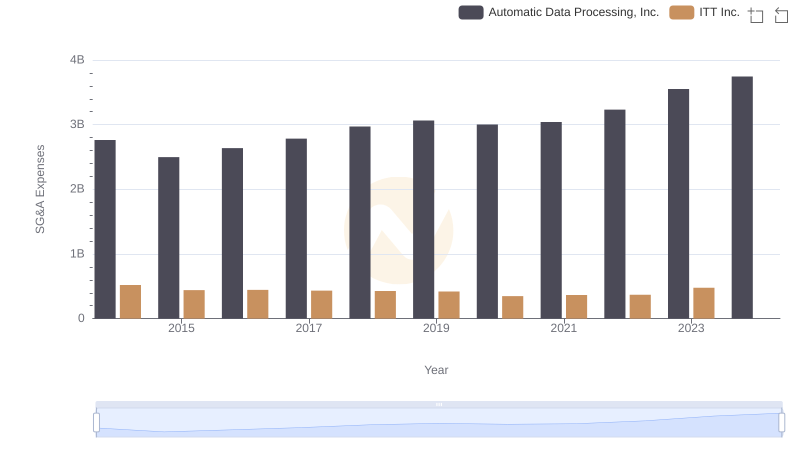
Who Optimizes SG&A Costs Better? Automatic Data Processing, Inc. or ITT Inc.