| __timestamp | Automatic Data Processing, Inc. | Nordson Corporation |
|---|---|---|
| Wednesday, January 1, 2014 | 4611400000 | 945098000 |
| Thursday, January 1, 2015 | 4133200000 | 913964000 |
| Friday, January 1, 2016 | 4450200000 | 993499000 |
| Sunday, January 1, 2017 | 4712600000 | 1139001000 |
| Monday, January 1, 2018 | 5016700000 | 1235965000 |
| Tuesday, January 1, 2019 | 5526700000 | 1192103000 |
| Wednesday, January 1, 2020 | 6144700000 | 1130468000 |
| Friday, January 1, 2021 | 6365100000 | 1324080000 |
| Saturday, January 1, 2022 | 7036400000 | 1426536000 |
| Sunday, January 1, 2023 | 8058800000 | 1425405000 |
| Monday, January 1, 2024 | 8725900000 | 1486129000 |
In pursuit of knowledge
In the ever-evolving landscape of corporate finance, understanding the trajectory of gross profits is crucial for investors and analysts alike. This chart offers a comparative analysis of Automatic Data Processing, Inc. (ADP) and Nordson Corporation over the past decade, from 2014 to 2024.
ADP has demonstrated a robust growth trajectory, with its gross profit increasing by approximately 89% over the ten-year period. Starting at around $4.6 billion in 2014, ADP's gross profit surged to nearly $8.7 billion by 2024, reflecting its strong market position and strategic growth initiatives.
In contrast, Nordson Corporation's gross profit grew by about 57% during the same period. From just under $945 million in 2014, it reached approximately $1.5 billion in 2024. This steady growth underscores Nordson's resilience and adaptability in a competitive market.
Both companies have shown impressive growth, but ADP's more aggressive upward trend highlights its dynamic approach to capturing market share.
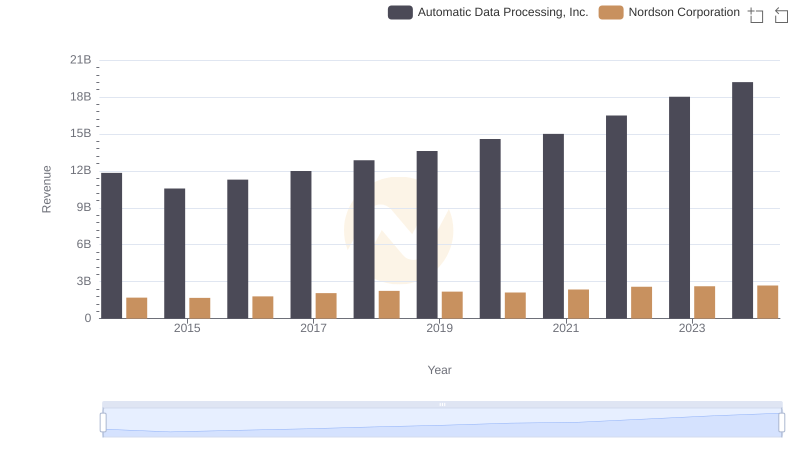
Who Generates More Revenue? Automatic Data Processing, Inc. or Nordson Corporation
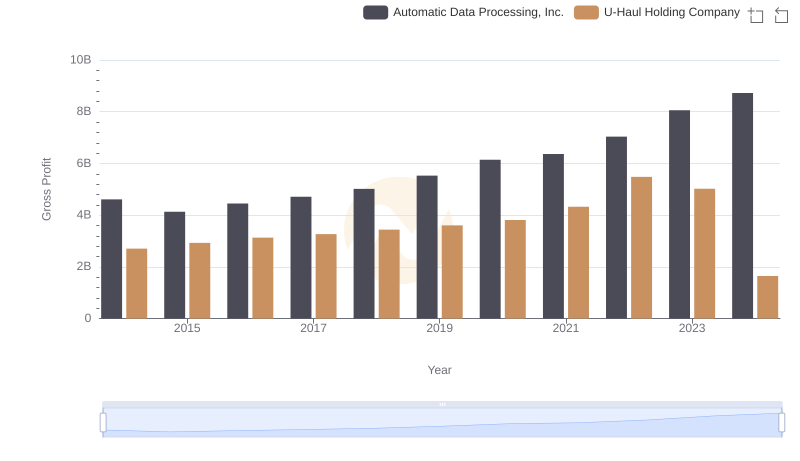
Gross Profit Analysis: Comparing Automatic Data Processing, Inc. and U-Haul Holding Company
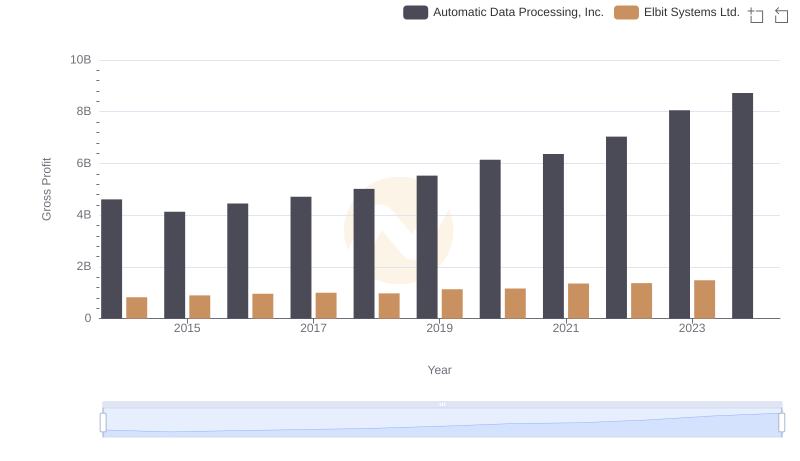
Automatic Data Processing, Inc. vs Elbit Systems Ltd.: A Gross Profit Performance Breakdown

Key Insights on Gross Profit: Automatic Data Processing, Inc. vs C.H. Robinson Worldwide, Inc.
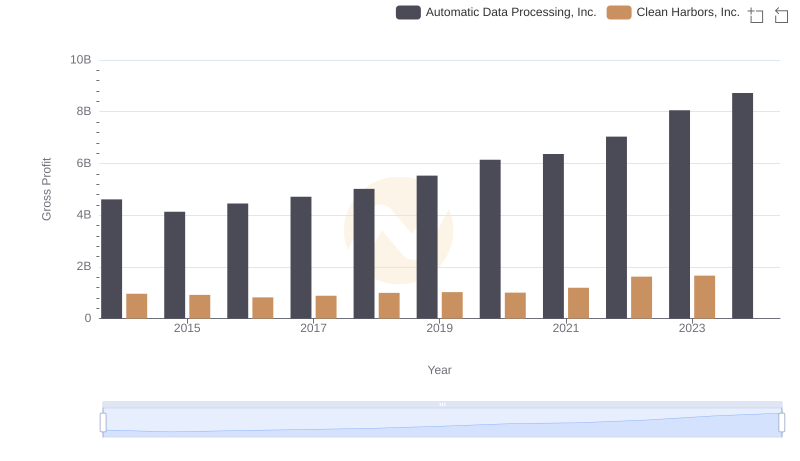
Gross Profit Trends Compared: Automatic Data Processing, Inc. vs Clean Harbors, Inc.
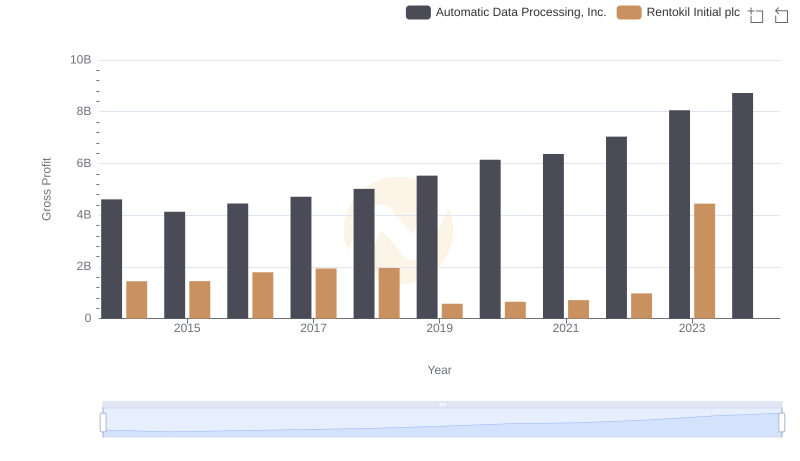
Who Generates Higher Gross Profit? Automatic Data Processing, Inc. or Rentokil Initial plc
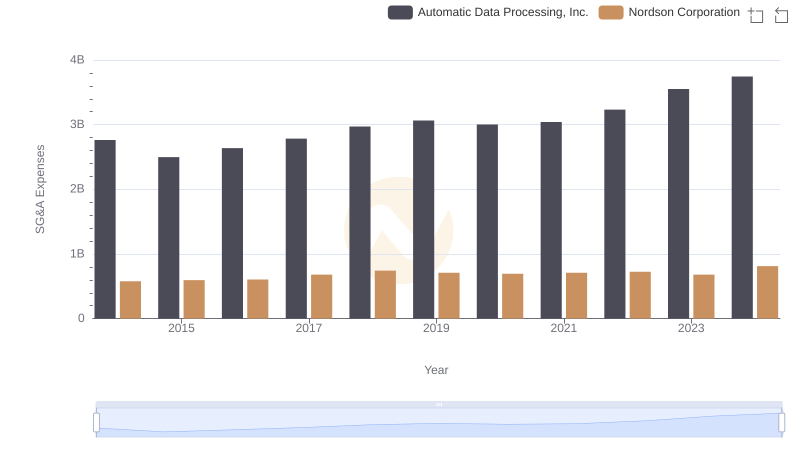
Automatic Data Processing, Inc. vs Nordson Corporation: SG&A Expense Trends

Automatic Data Processing, Inc. vs Nordson Corporation: In-Depth EBITDA Performance Comparison