| __timestamp | Automatic Data Processing, Inc. | Clean Harbors, Inc. |
|---|---|---|
| Wednesday, January 1, 2014 | 2762400000 | 437921000 |
| Thursday, January 1, 2015 | 2496900000 | 414164000 |
| Friday, January 1, 2016 | 2637000000 | 422015000 |
| Sunday, January 1, 2017 | 2783200000 | 456648000 |
| Monday, January 1, 2018 | 2971500000 | 503747000 |
| Tuesday, January 1, 2019 | 3064200000 | 484054000 |
| Wednesday, January 1, 2020 | 3003000000 | 451044000 |
| Friday, January 1, 2021 | 3040500000 | 537962000 |
| Saturday, January 1, 2022 | 3233200000 | 627391000 |
| Sunday, January 1, 2023 | 3551400000 | 671161000 |
| Monday, January 1, 2024 | 3778900000 | 739629000 |
Cracking the code
In the ever-evolving landscape of corporate finance, understanding the spending patterns of industry giants can offer valuable insights. Over the past decade, Automatic Data Processing, Inc. (ADP) and Clean Harbors, Inc. have showcased distinct trajectories in their Selling, General, and Administrative (SG&A) expenses.
ADP's SG&A expenses have seen a steady climb, increasing by approximately 36% from 2014 to 2023. This growth reflects ADP's strategic investments in operational efficiency and market expansion. In contrast, Clean Harbors, Inc. has experienced a more modest rise of around 53% over the same period, indicating a focus on maintaining lean operations while navigating industry challenges.
Interestingly, the data for 2024 is incomplete, highlighting the dynamic nature of financial forecasting. As these companies continue to adapt, their SG&A spending will remain a critical indicator of their strategic priorities and market positioning.
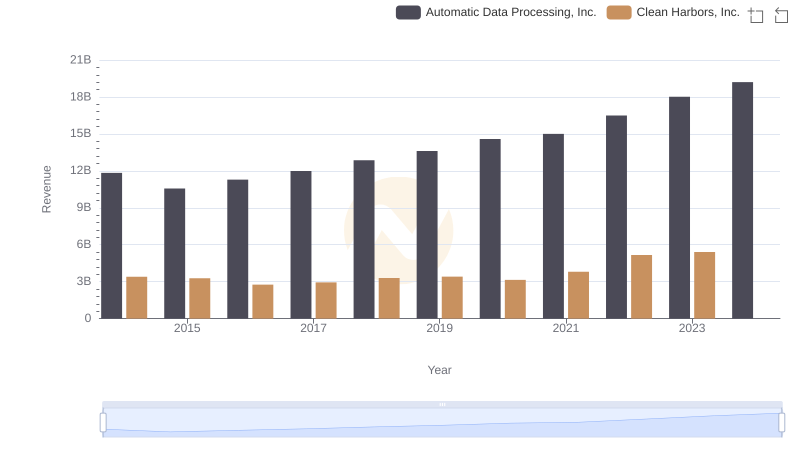
Automatic Data Processing, Inc. vs Clean Harbors, Inc.: Examining Key Revenue Metrics

Operational Costs Compared: SG&A Analysis of Automatic Data Processing, Inc. and U-Haul Holding Company
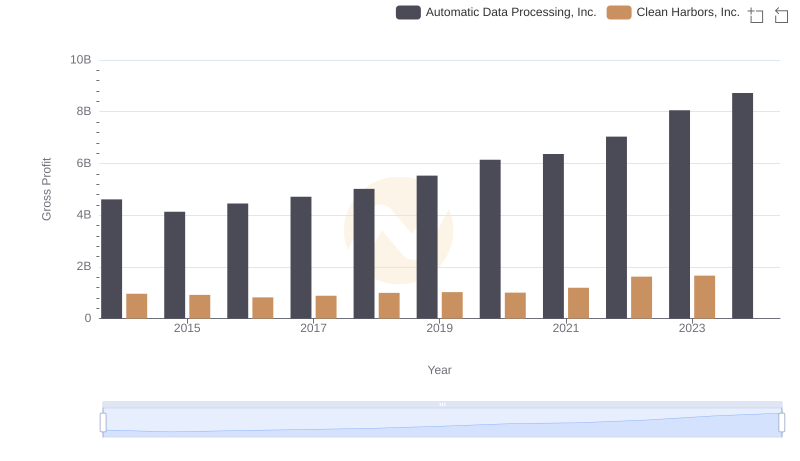
Gross Profit Trends Compared: Automatic Data Processing, Inc. vs Clean Harbors, Inc.
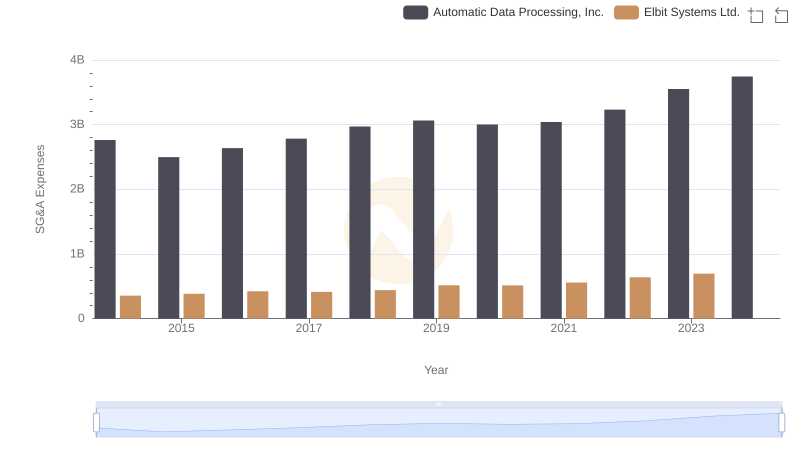
Operational Costs Compared: SG&A Analysis of Automatic Data Processing, Inc. and Elbit Systems Ltd.

Who Optimizes SG&A Costs Better? Automatic Data Processing, Inc. or C.H. Robinson Worldwide, Inc.
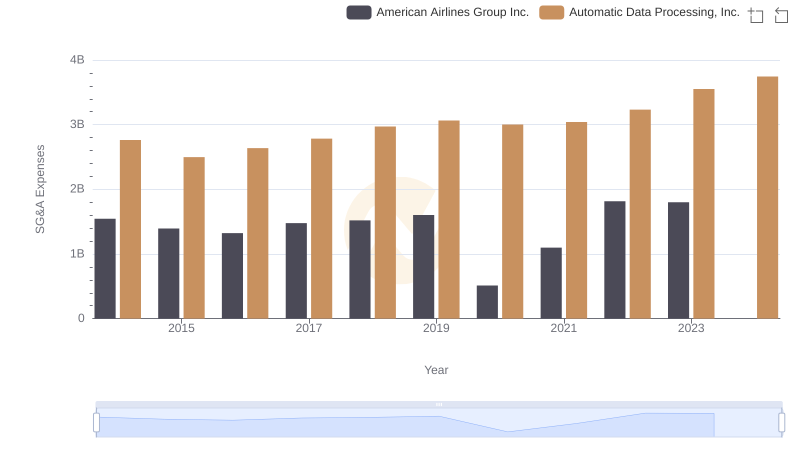
SG&A Efficiency Analysis: Comparing Automatic Data Processing, Inc. and American Airlines Group Inc.
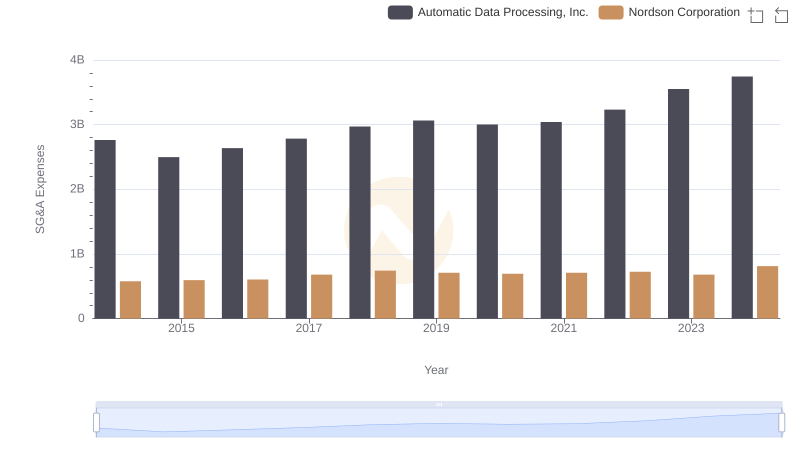
Automatic Data Processing, Inc. vs Nordson Corporation: SG&A Expense Trends
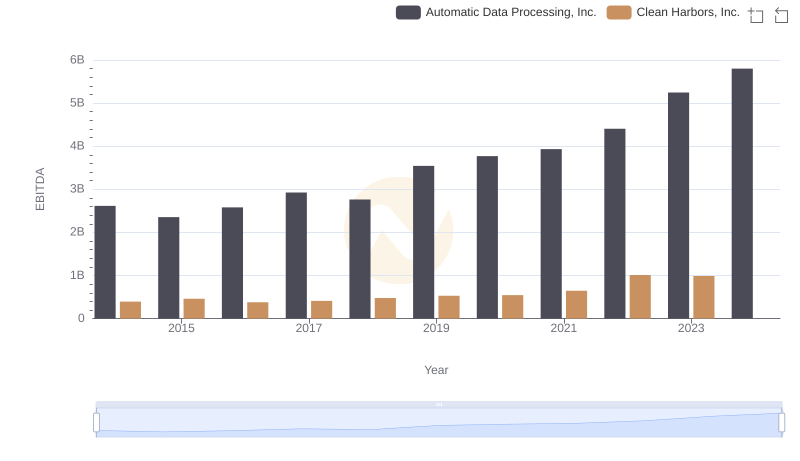
EBITDA Performance Review: Automatic Data Processing, Inc. vs Clean Harbors, Inc.

Operational Costs Compared: SG&A Analysis of Automatic Data Processing, Inc. and Allegion plc
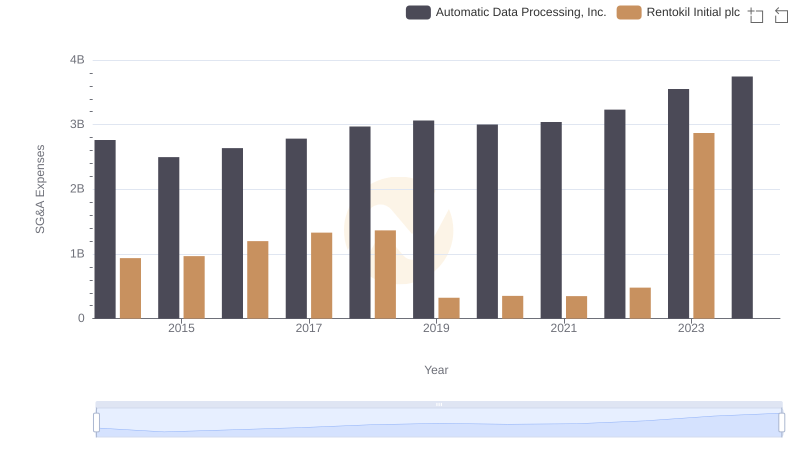
Operational Costs Compared: SG&A Analysis of Automatic Data Processing, Inc. and Rentokil Initial plc
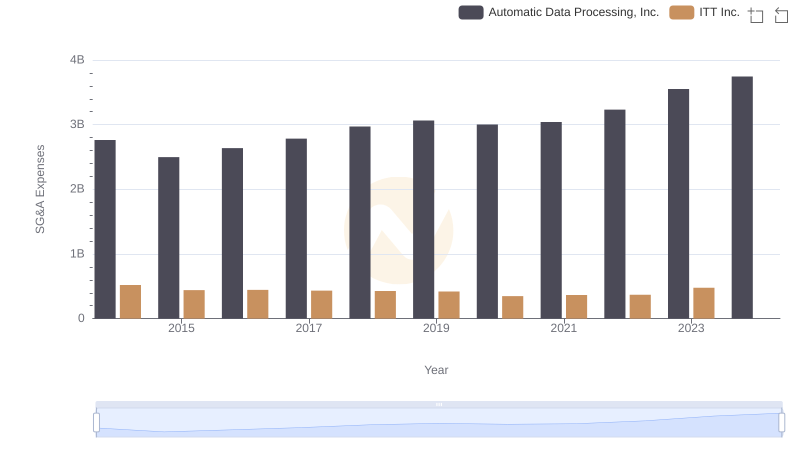
Who Optimizes SG&A Costs Better? Automatic Data Processing, Inc. or ITT Inc.