| __timestamp | Automatic Data Processing, Inc. | Rentokil Initial plc |
|---|---|---|
| Wednesday, January 1, 2014 | 2762400000 | 935700000 |
| Thursday, January 1, 2015 | 2496900000 | 965700000 |
| Friday, January 1, 2016 | 2637000000 | 1197600000 |
| Sunday, January 1, 2017 | 2783200000 | 1329600000 |
| Monday, January 1, 2018 | 2971500000 | 1364000000 |
| Tuesday, January 1, 2019 | 3064200000 | 322500000 |
| Wednesday, January 1, 2020 | 3003000000 | 352000000 |
| Friday, January 1, 2021 | 3040500000 | 348600000 |
| Saturday, January 1, 2022 | 3233200000 | 479000000 |
| Sunday, January 1, 2023 | 3551400000 | 2870000000 |
| Monday, January 1, 2024 | 3778900000 |
Cracking the code
In the ever-evolving landscape of corporate finance, understanding operational costs is crucial. This analysis delves into the Selling, General, and Administrative (SG&A) expenses of two industry giants: Automatic Data Processing, Inc. (ADP) and Rentokil Initial plc, from 2014 to 2023. Over this period, ADP's SG&A expenses have shown a steady upward trend, peaking at approximately $3.7 billion in 2023, marking a 36% increase from 2014. In contrast, Rentokil's expenses fluctuated, with a significant spike in 2023, reaching nearly $2.9 billion, a dramatic rise from previous years. This divergence highlights differing strategic approaches to operational management. While ADP's consistent growth reflects stable expansion, Rentokil's volatility suggests adaptive strategies in response to market dynamics. Notably, data for 2024 is incomplete, indicating potential shifts in future trends.
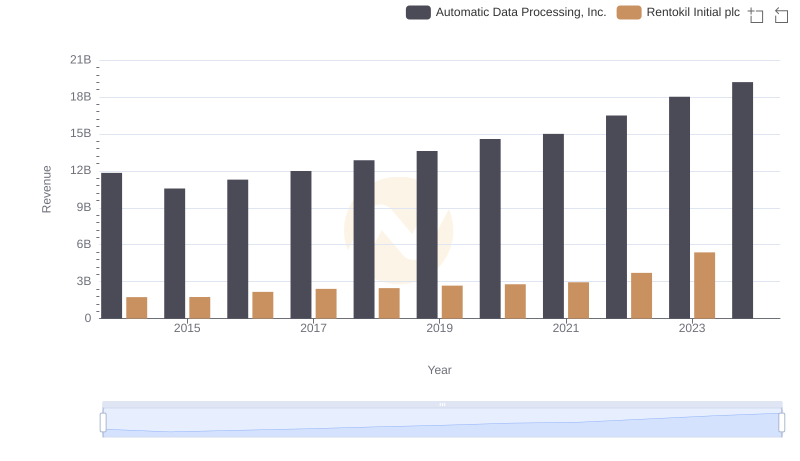
Annual Revenue Comparison: Automatic Data Processing, Inc. vs Rentokil Initial plc
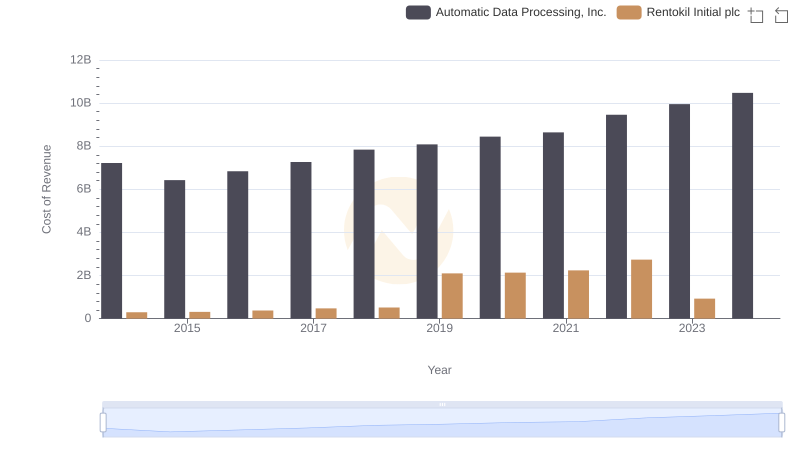
Cost of Revenue Comparison: Automatic Data Processing, Inc. vs Rentokil Initial plc

Operational Costs Compared: SG&A Analysis of Automatic Data Processing, Inc. and U-Haul Holding Company
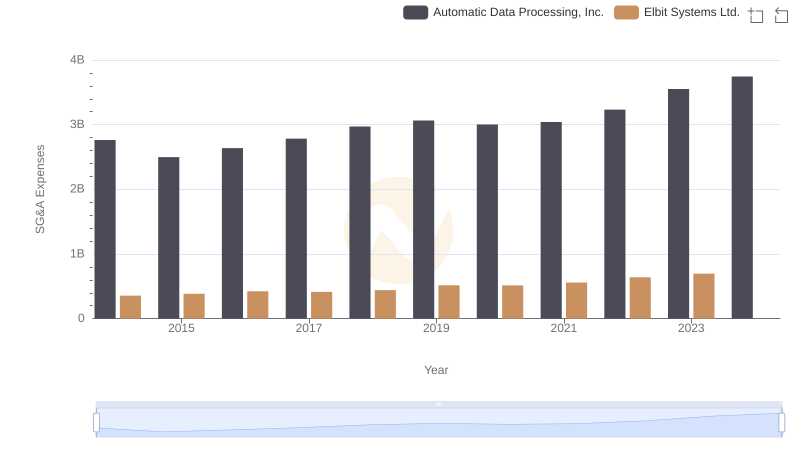
Operational Costs Compared: SG&A Analysis of Automatic Data Processing, Inc. and Elbit Systems Ltd.

Who Optimizes SG&A Costs Better? Automatic Data Processing, Inc. or C.H. Robinson Worldwide, Inc.
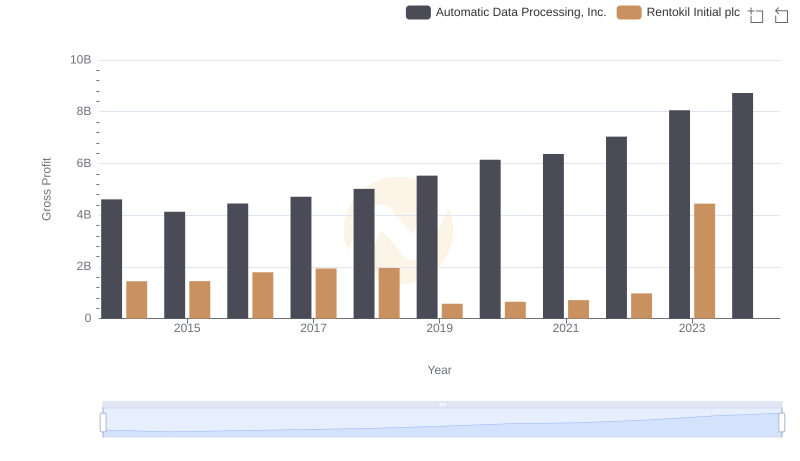
Who Generates Higher Gross Profit? Automatic Data Processing, Inc. or Rentokil Initial plc
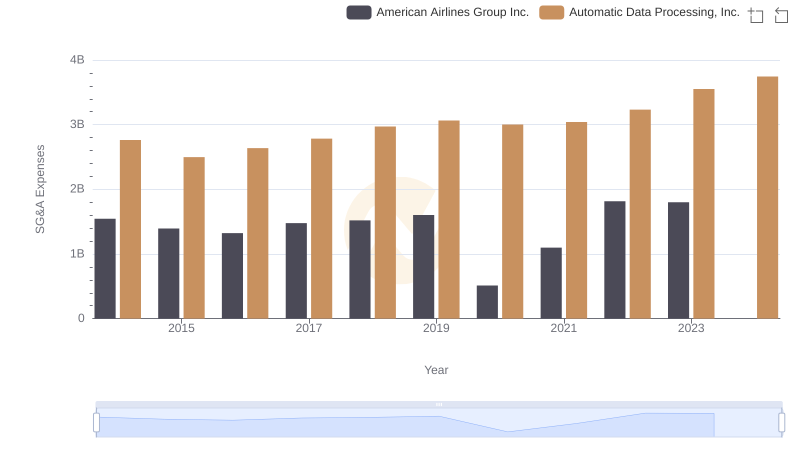
SG&A Efficiency Analysis: Comparing Automatic Data Processing, Inc. and American Airlines Group Inc.
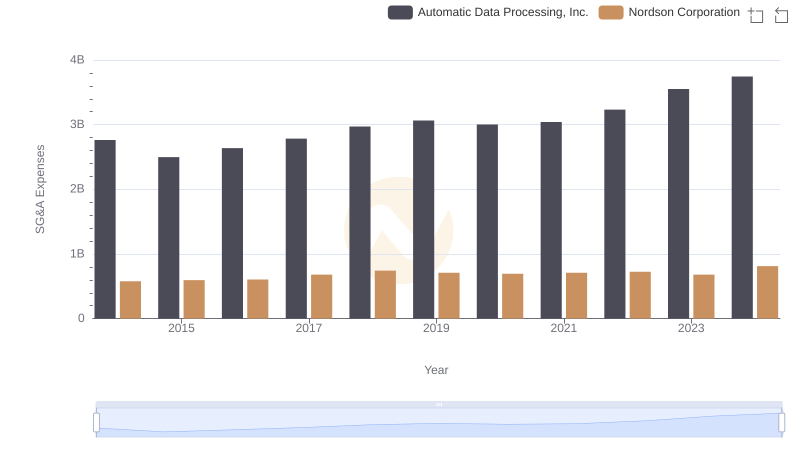
Automatic Data Processing, Inc. vs Nordson Corporation: SG&A Expense Trends
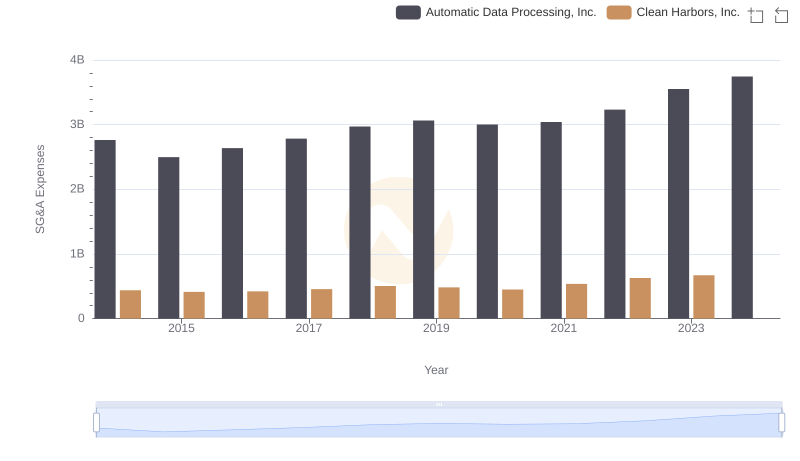
Automatic Data Processing, Inc. and Clean Harbors, Inc.: SG&A Spending Patterns Compared

Operational Costs Compared: SG&A Analysis of Automatic Data Processing, Inc. and Allegion plc
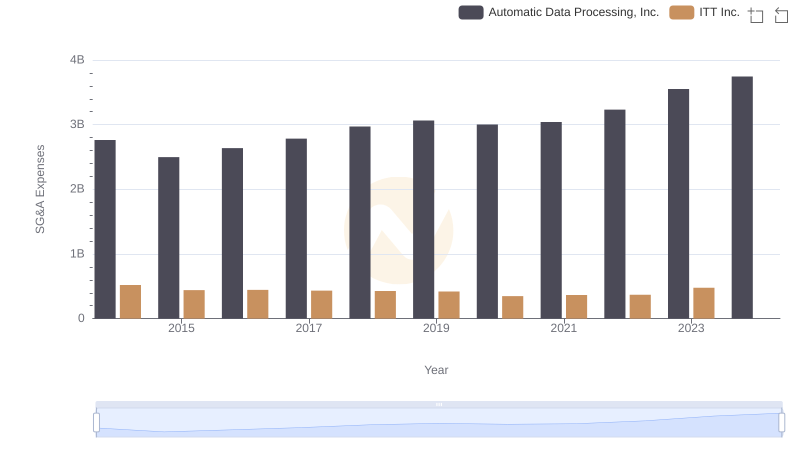
Who Optimizes SG&A Costs Better? Automatic Data Processing, Inc. or ITT Inc.
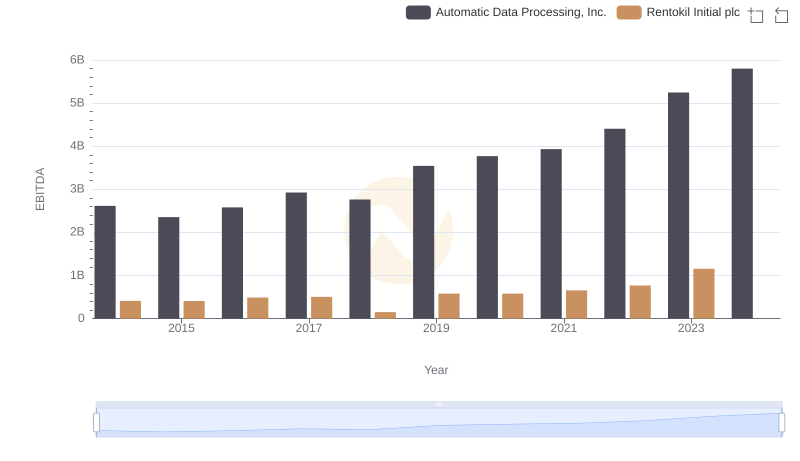
A Side-by-Side Analysis of EBITDA: Automatic Data Processing, Inc. and Rentokil Initial plc