| __timestamp | Automatic Data Processing, Inc. | Elbit Systems Ltd. |
|---|---|---|
| Wednesday, January 1, 2014 | 4611400000 | 825097000 |
| Thursday, January 1, 2015 | 4133200000 | 897053000 |
| Friday, January 1, 2016 | 4450200000 | 959583000 |
| Sunday, January 1, 2017 | 4712600000 | 997920000 |
| Monday, January 1, 2018 | 5016700000 | 976179000 |
| Tuesday, January 1, 2019 | 5526700000 | 1136467000 |
| Wednesday, January 1, 2020 | 6144700000 | 1165107000 |
| Friday, January 1, 2021 | 6365100000 | 1358048000 |
| Saturday, January 1, 2022 | 7036400000 | 1373283000 |
| Sunday, January 1, 2023 | 8058800000 | 1482954000 |
| Monday, January 1, 2024 | 8725900000 |
Unleashing the power of data
In the ever-evolving landscape of global business, understanding the financial health of companies is crucial. This analysis delves into the gross profit performance of two industry giants: Automatic Data Processing, Inc. (ADP) and Elbit Systems Ltd., from 2014 to 2023.
ADP has demonstrated a robust growth trajectory, with its gross profit surging by approximately 89% over the decade. Starting at around $4.6 billion in 2014, it reached an impressive $8.1 billion by 2023. This consistent upward trend underscores ADP's strategic prowess in the competitive market.
Conversely, Elbit Systems Ltd. has shown a steady, albeit more modest, growth of about 80% in the same period. From $825 million in 2014, it climbed to nearly $1.5 billion by 2023. Notably, data for 2024 is missing, leaving room for speculation on future performance.
These insights offer a compelling glimpse into the financial strategies and market positions of these two companies.
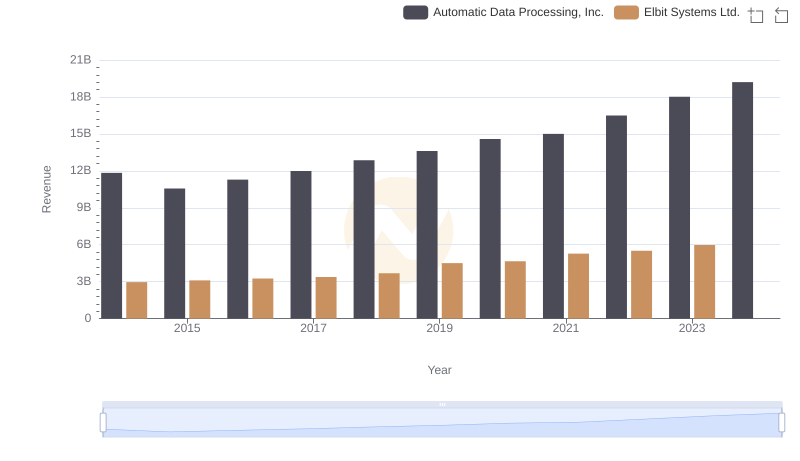
Annual Revenue Comparison: Automatic Data Processing, Inc. vs Elbit Systems Ltd.
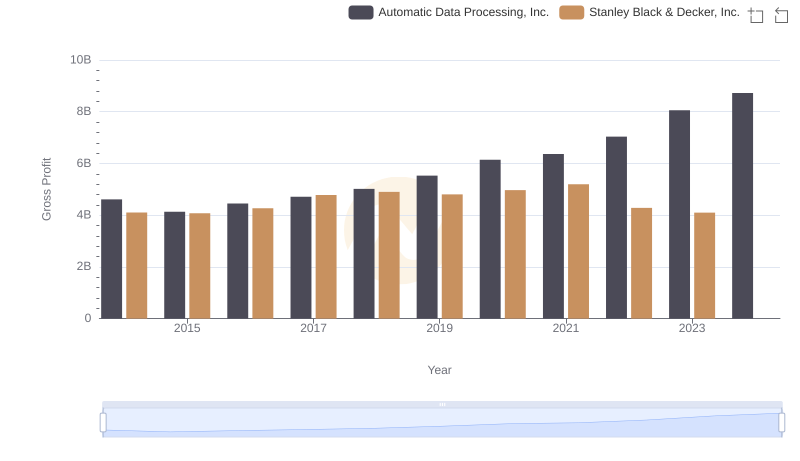
Key Insights on Gross Profit: Automatic Data Processing, Inc. vs Stanley Black & Decker, Inc.
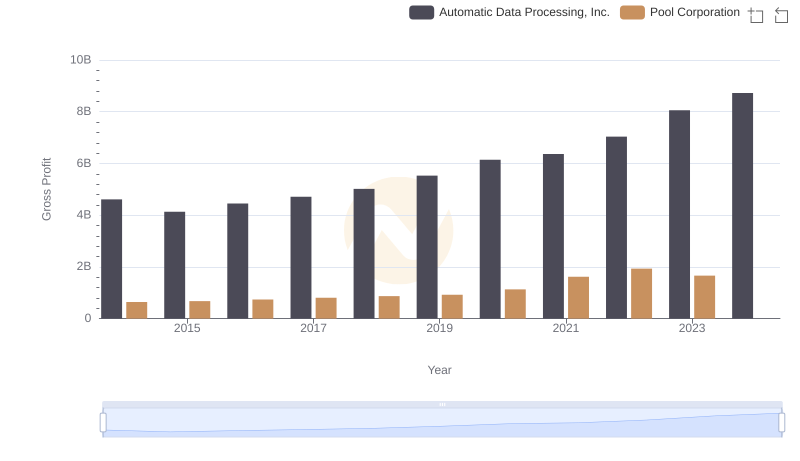
Gross Profit Comparison: Automatic Data Processing, Inc. and Pool Corporation Trends
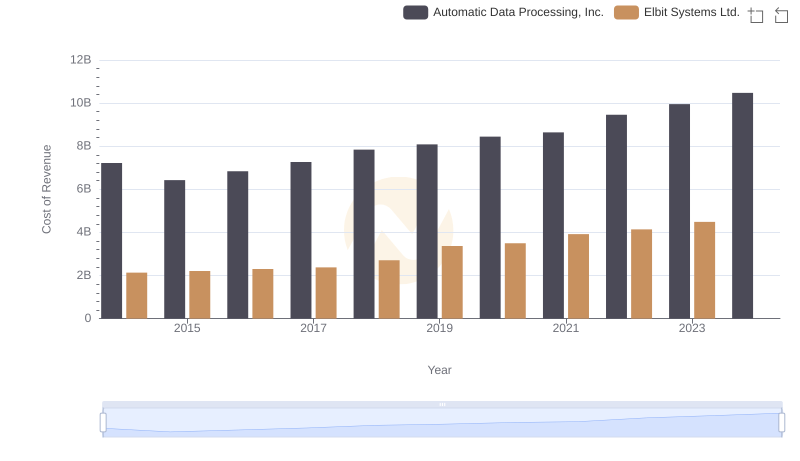
Automatic Data Processing, Inc. vs Elbit Systems Ltd.: Efficiency in Cost of Revenue Explored
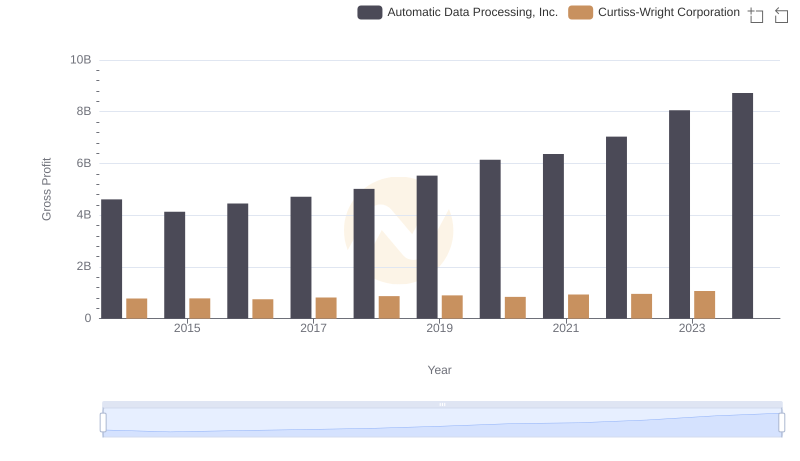
Who Generates Higher Gross Profit? Automatic Data Processing, Inc. or Curtiss-Wright Corporation
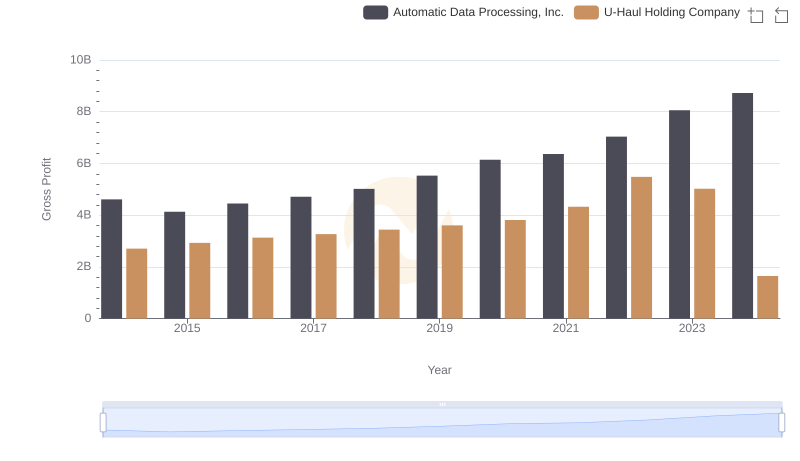
Gross Profit Analysis: Comparing Automatic Data Processing, Inc. and U-Haul Holding Company

Key Insights on Gross Profit: Automatic Data Processing, Inc. vs C.H. Robinson Worldwide, Inc.
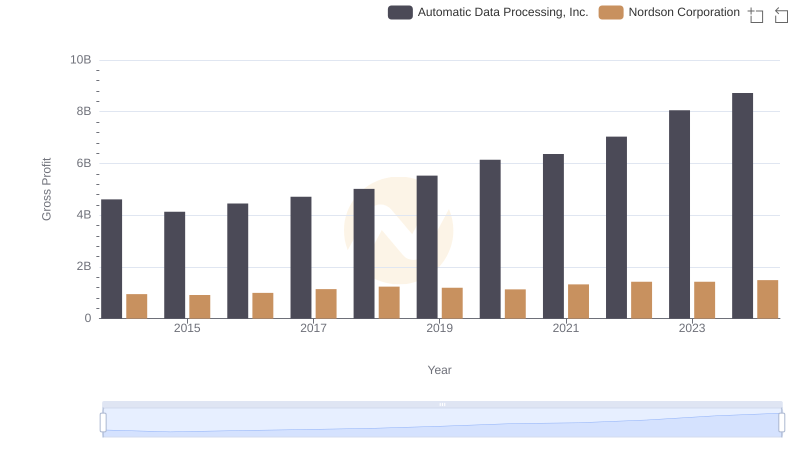
Gross Profit Trends Compared: Automatic Data Processing, Inc. vs Nordson Corporation
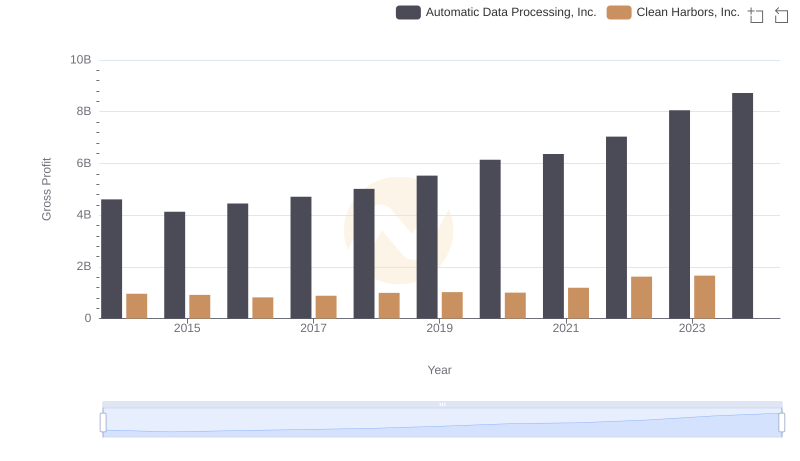
Gross Profit Trends Compared: Automatic Data Processing, Inc. vs Clean Harbors, Inc.
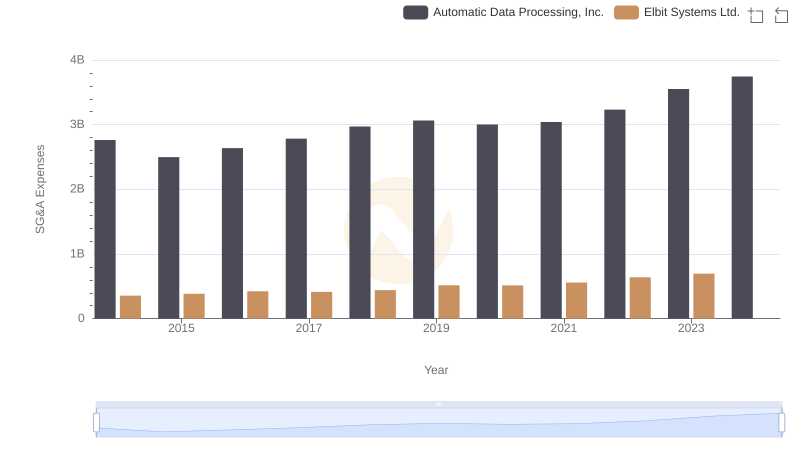
Operational Costs Compared: SG&A Analysis of Automatic Data Processing, Inc. and Elbit Systems Ltd.
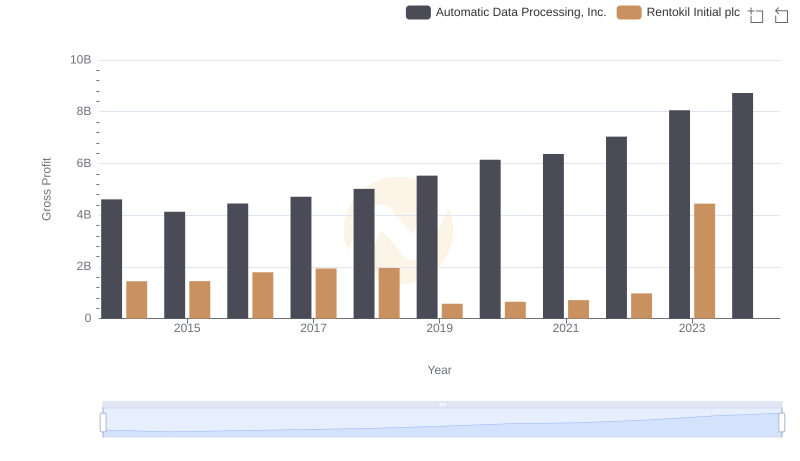
Who Generates Higher Gross Profit? Automatic Data Processing, Inc. or Rentokil Initial plc
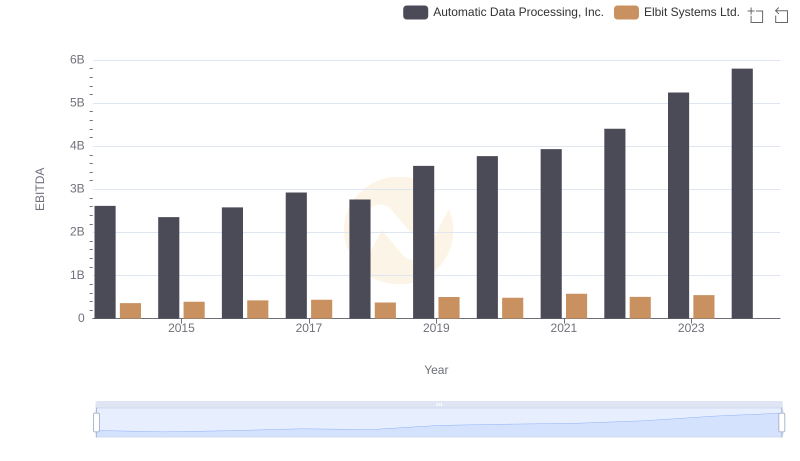
Comprehensive EBITDA Comparison: Automatic Data Processing, Inc. vs Elbit Systems Ltd.