| __timestamp | Automatic Data Processing, Inc. | Elbit Systems Ltd. |
|---|---|---|
| Wednesday, January 1, 2014 | 2616900000 | 358274000 |
| Thursday, January 1, 2015 | 2355100000 | 390932000 |
| Friday, January 1, 2016 | 2579500000 | 424003291 |
| Sunday, January 1, 2017 | 2927200000 | 438616108 |
| Monday, January 1, 2018 | 2762900000 | 374866620 |
| Tuesday, January 1, 2019 | 3544500000 | 502866000 |
| Wednesday, January 1, 2020 | 3769700000 | 484464000 |
| Friday, January 1, 2021 | 3931600000 | 576645646 |
| Saturday, January 1, 2022 | 4405500000 | 505269000 |
| Sunday, January 1, 2023 | 5244600000 | 544811000 |
| Monday, January 1, 2024 | 5800000000 |
Infusing magic into the data realm
In the ever-evolving landscape of global business, understanding financial health is crucial. This chart offers a comprehensive comparison of EBITDA trends for Automatic Data Processing, Inc. (ADP) and Elbit Systems Ltd. from 2014 to 2023. Over this period, ADP has demonstrated a robust growth trajectory, with its EBITDA increasing by approximately 122%, from $2.6 billion in 2014 to an impressive $5.8 billion in 2023. In contrast, Elbit Systems Ltd. has shown a more modest growth of around 52%, with EBITDA rising from $358 million to $545 million over the same period.
The data highlights ADP's consistent upward trend, particularly notable in the last five years, where it surged by nearly 55%. Meanwhile, Elbit Systems experienced fluctuations, peaking in 2021. The absence of data for Elbit Systems in 2024 suggests a need for further investigation into recent financial disclosures.
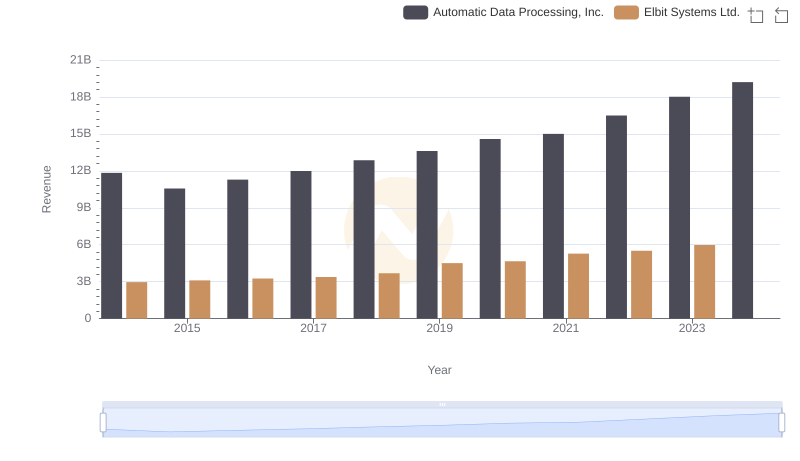
Annual Revenue Comparison: Automatic Data Processing, Inc. vs Elbit Systems Ltd.
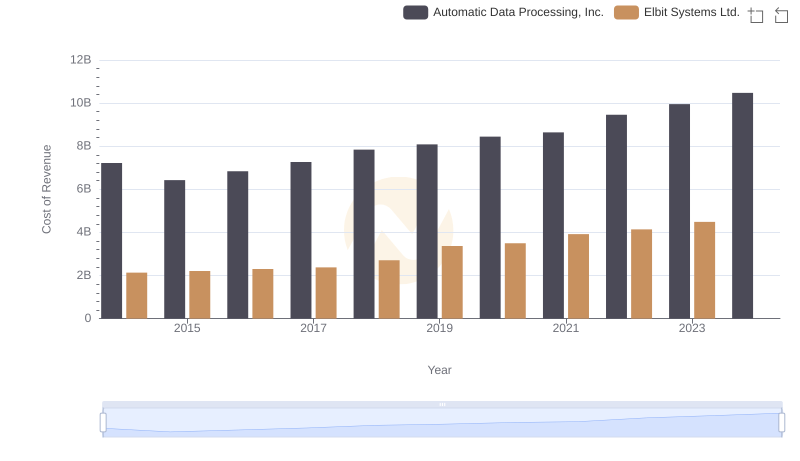
Automatic Data Processing, Inc. vs Elbit Systems Ltd.: Efficiency in Cost of Revenue Explored
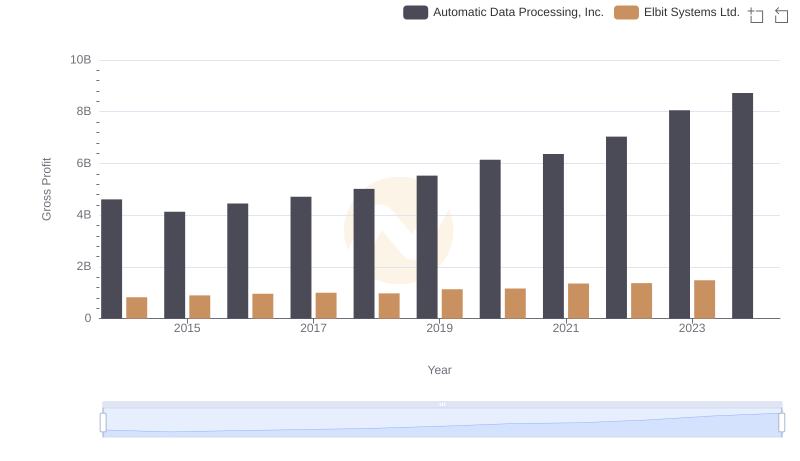
Automatic Data Processing, Inc. vs Elbit Systems Ltd.: A Gross Profit Performance Breakdown
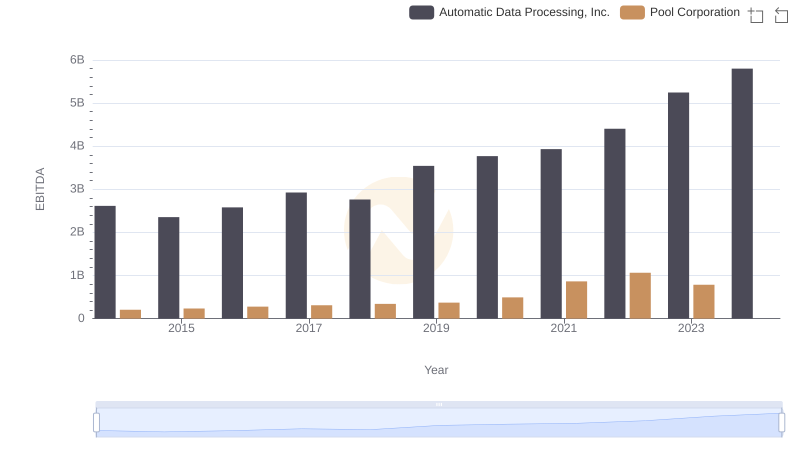
Professional EBITDA Benchmarking: Automatic Data Processing, Inc. vs Pool Corporation
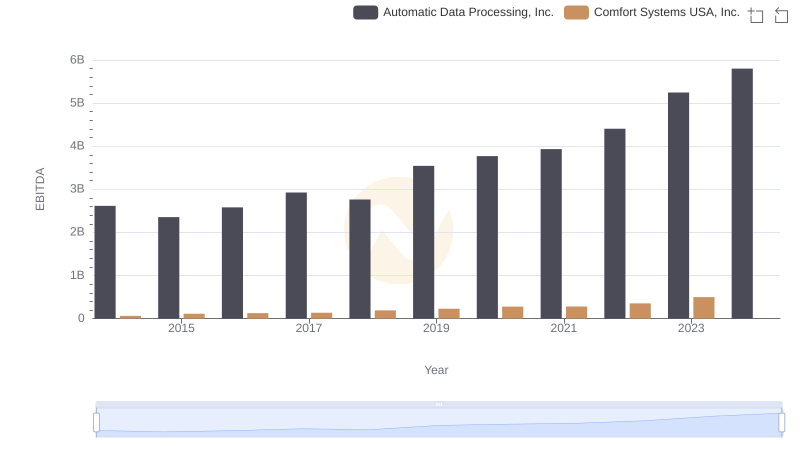
EBITDA Analysis: Evaluating Automatic Data Processing, Inc. Against Comfort Systems USA, Inc.
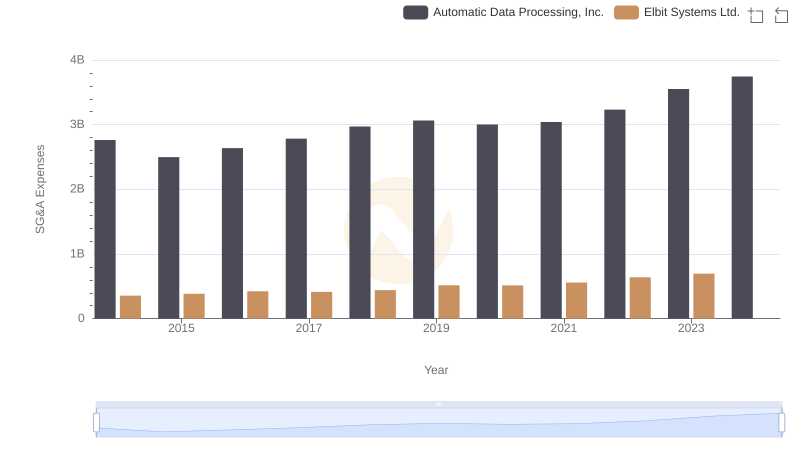
Operational Costs Compared: SG&A Analysis of Automatic Data Processing, Inc. and Elbit Systems Ltd.
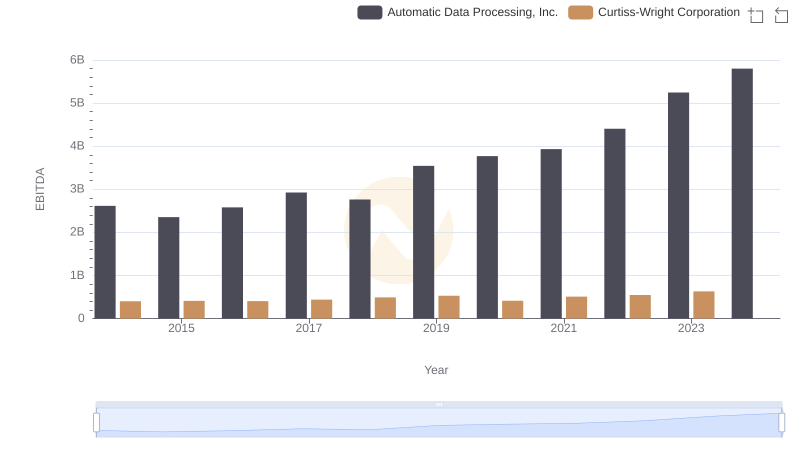
A Side-by-Side Analysis of EBITDA: Automatic Data Processing, Inc. and Curtiss-Wright Corporation

A Professional Review of EBITDA: Automatic Data Processing, Inc. Compared to U-Haul Holding Company

Automatic Data Processing, Inc. vs Nordson Corporation: In-Depth EBITDA Performance Comparison
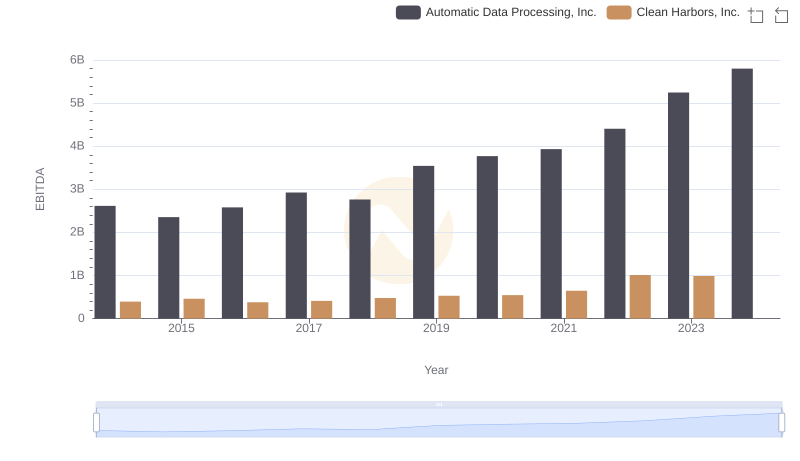
EBITDA Performance Review: Automatic Data Processing, Inc. vs Clean Harbors, Inc.
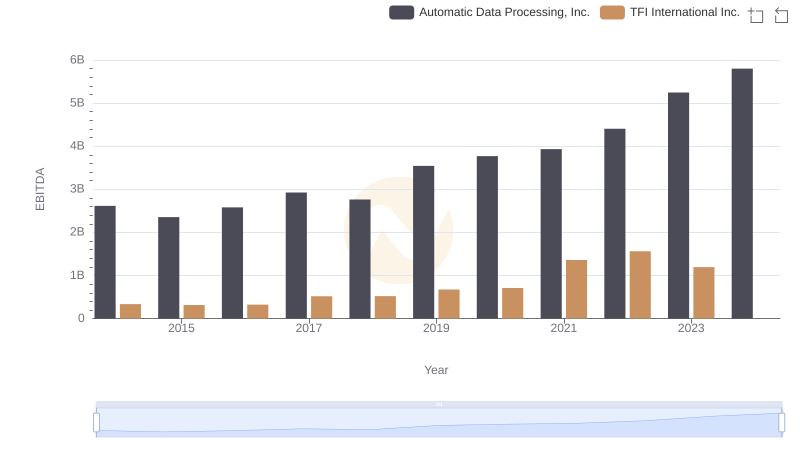
Automatic Data Processing, Inc. vs TFI International Inc.: In-Depth EBITDA Performance Comparison