| __timestamp | Automatic Data Processing, Inc. | Clean Harbors, Inc. |
|---|---|---|
| Wednesday, January 1, 2014 | 4611400000 | 959840000 |
| Thursday, January 1, 2015 | 4133200000 | 918331000 |
| Friday, January 1, 2016 | 4450200000 | 822369000 |
| Sunday, January 1, 2017 | 4712600000 | 882305000 |
| Monday, January 1, 2018 | 5016700000 | 994752000 |
| Tuesday, January 1, 2019 | 5526700000 | 1024371000 |
| Wednesday, January 1, 2020 | 6144700000 | 1006346000 |
| Friday, January 1, 2021 | 6365100000 | 1195729000 |
| Saturday, January 1, 2022 | 7036400000 | 1622675000 |
| Sunday, January 1, 2023 | 8058800000 | 1663028000 |
| Monday, January 1, 2024 | 8725900000 | 1824239000 |
Unlocking the unknown
In the ever-evolving landscape of corporate finance, understanding gross profit trends is crucial for investors and analysts alike. This chart offers a fascinating comparison between Automatic Data Processing, Inc. (ADP) and Clean Harbors, Inc. over the past decade.
From 2014 to 2023, ADP has demonstrated a robust growth trajectory, with its gross profit increasing by approximately 89%. This growth reflects ADP's strategic initiatives and market adaptability. In contrast, Clean Harbors, Inc. has shown a more modest increase of around 73% over the same period, highlighting its steady yet less aggressive expansion strategy.
While ADP's data extends into 2024, Clean Harbors' figures are notably absent, suggesting potential reporting delays or strategic shifts. This missing data invites speculation and underscores the importance of timely financial disclosures.
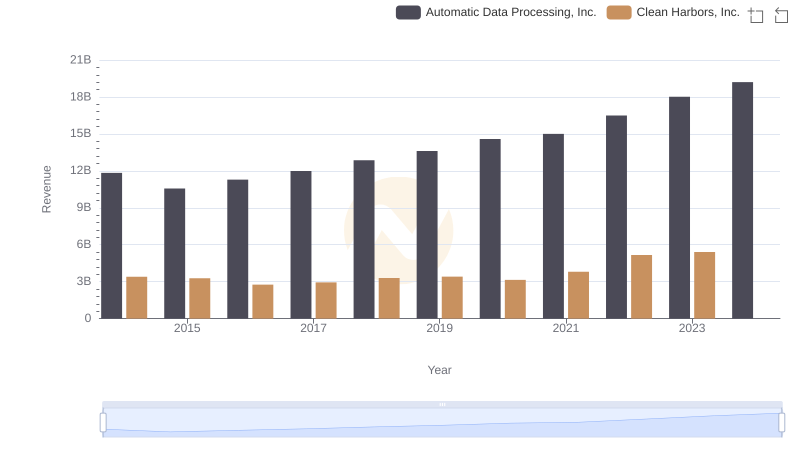
Automatic Data Processing, Inc. vs Clean Harbors, Inc.: Examining Key Revenue Metrics
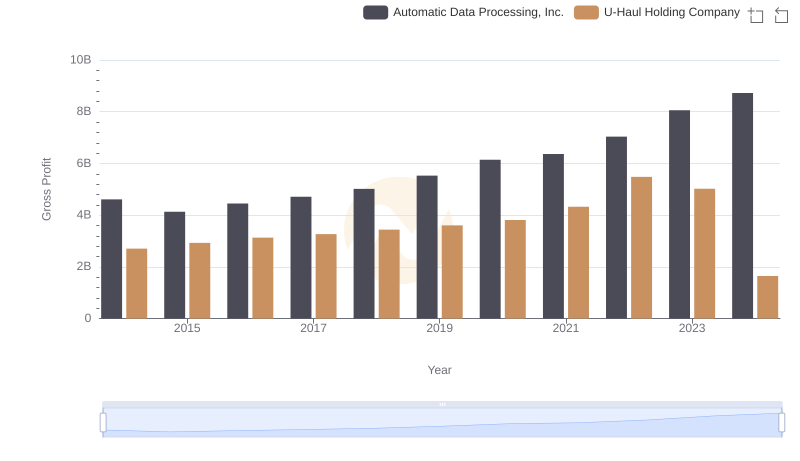
Gross Profit Analysis: Comparing Automatic Data Processing, Inc. and U-Haul Holding Company
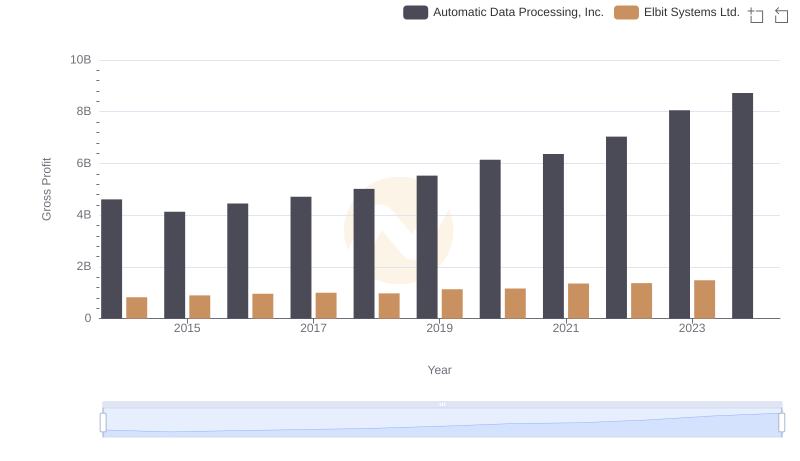
Automatic Data Processing, Inc. vs Elbit Systems Ltd.: A Gross Profit Performance Breakdown

Key Insights on Gross Profit: Automatic Data Processing, Inc. vs C.H. Robinson Worldwide, Inc.
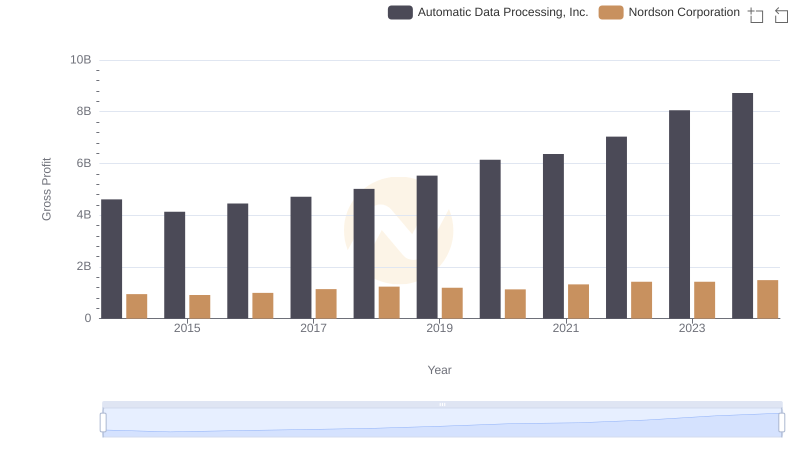
Gross Profit Trends Compared: Automatic Data Processing, Inc. vs Nordson Corporation
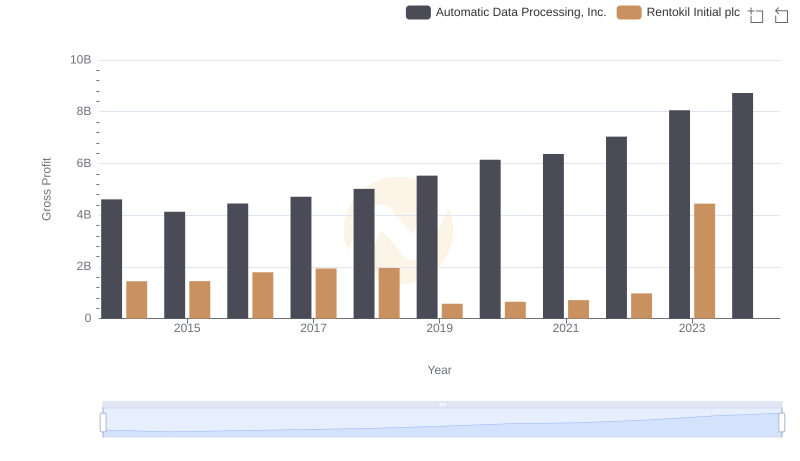
Who Generates Higher Gross Profit? Automatic Data Processing, Inc. or Rentokil Initial plc
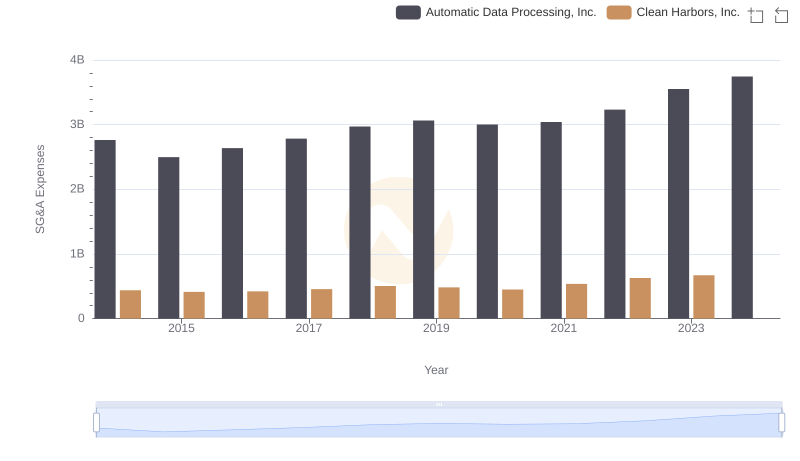
Automatic Data Processing, Inc. and Clean Harbors, Inc.: SG&A Spending Patterns Compared
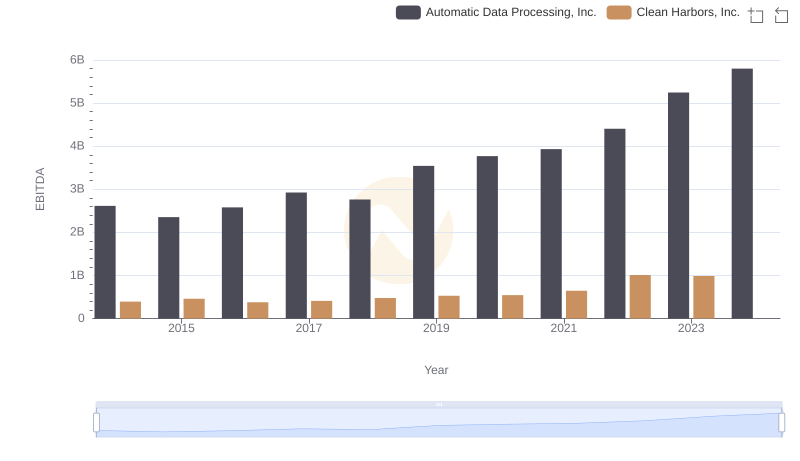
EBITDA Performance Review: Automatic Data Processing, Inc. vs Clean Harbors, Inc.