| __timestamp | Automatic Data Processing, Inc. | Pool Corporation |
|---|---|---|
| Wednesday, January 1, 2014 | 4611400000 | 643340000 |
| Thursday, January 1, 2015 | 4133200000 | 675644000 |
| Friday, January 1, 2016 | 4450200000 | 741087000 |
| Sunday, January 1, 2017 | 4712600000 | 805289000 |
| Monday, January 1, 2018 | 5016700000 | 870173000 |
| Tuesday, January 1, 2019 | 5526700000 | 924925000 |
| Wednesday, January 1, 2020 | 6144700000 | 1130902000 |
| Friday, January 1, 2021 | 6365100000 | 1617092000 |
| Saturday, January 1, 2022 | 7036400000 | 1933412000 |
| Sunday, January 1, 2023 | 8058800000 | 1660044000 |
| Monday, January 1, 2024 | 8725900000 |
Unleashing the power of data
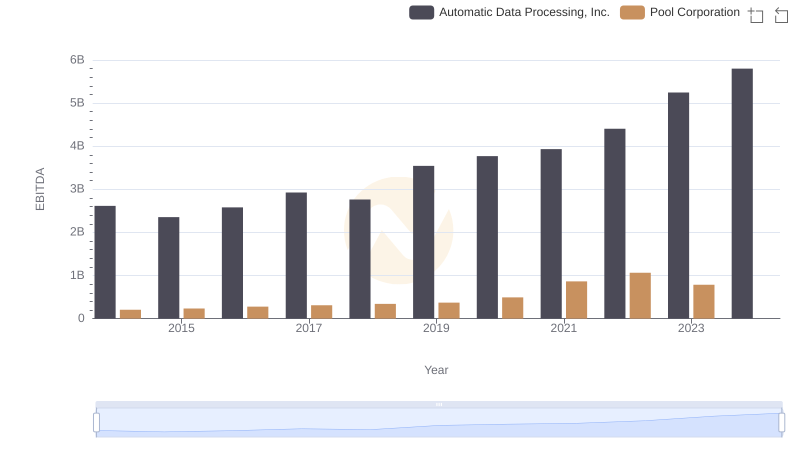
Over the past decade, Automatic Data Processing, Inc. (ADP) and Pool Corporation have showcased remarkable growth in their gross profits. ADP, a leader in human resources management, has seen its gross profit soar by approximately 89% from 2014 to 2023. Meanwhile, Pool Corporation, a major player in the pool supply industry, experienced a staggering 160% increase in gross profit from 2014 to 2022.
ADP's consistent upward trajectory, peaking in 2023, highlights its robust business model and adaptability in a dynamic market. Pool Corporation, despite missing data for 2024, demonstrated impressive growth until 2022, reflecting its strong market presence and consumer demand.
These trends underscore the resilience and strategic prowess of both companies, making them noteworthy contenders in their respective industries. As we look to the future, the potential for continued growth remains promising.
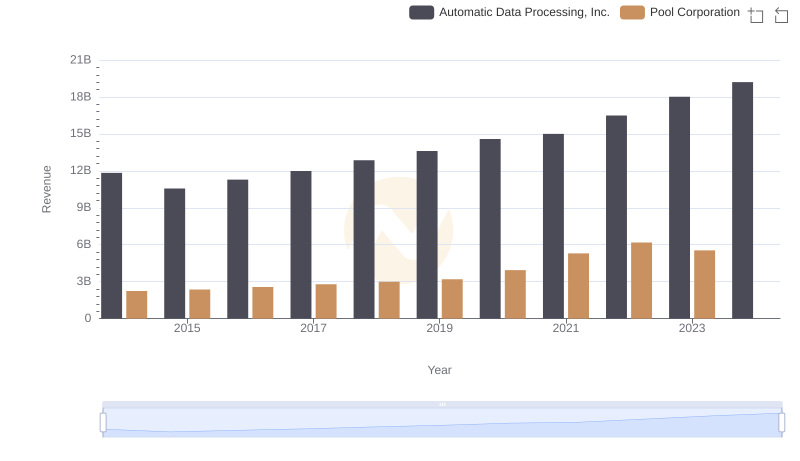
Revenue Showdown: Automatic Data Processing, Inc. vs Pool Corporation
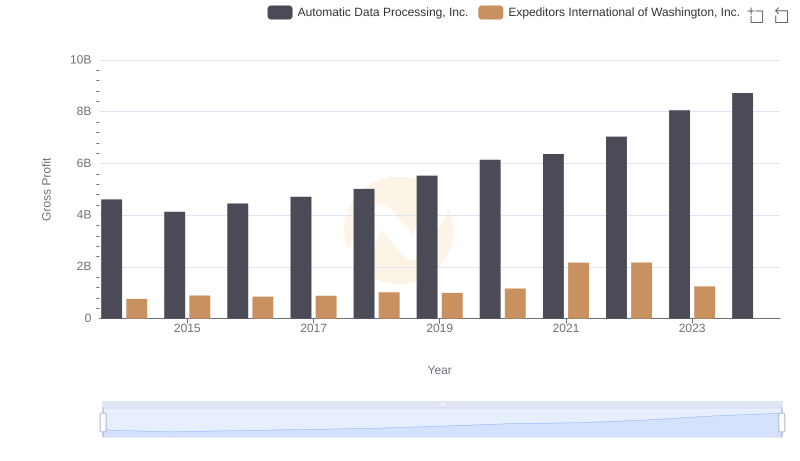
Gross Profit Comparison: Automatic Data Processing, Inc. and Expeditors International of Washington, Inc. Trends
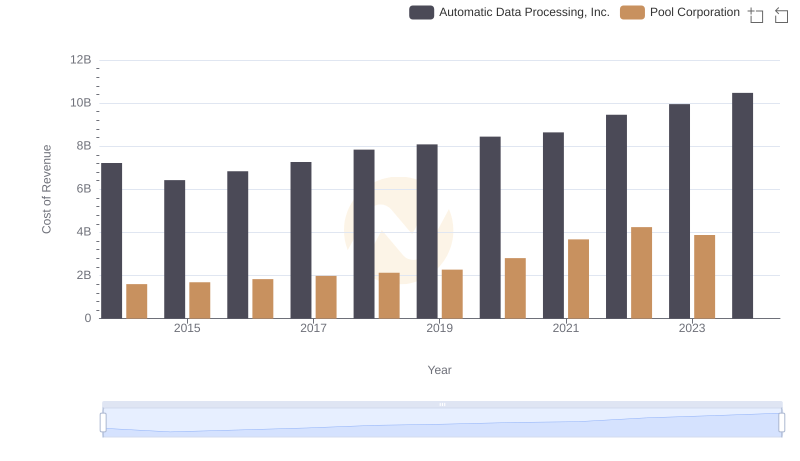
Analyzing Cost of Revenue: Automatic Data Processing, Inc. and Pool Corporation
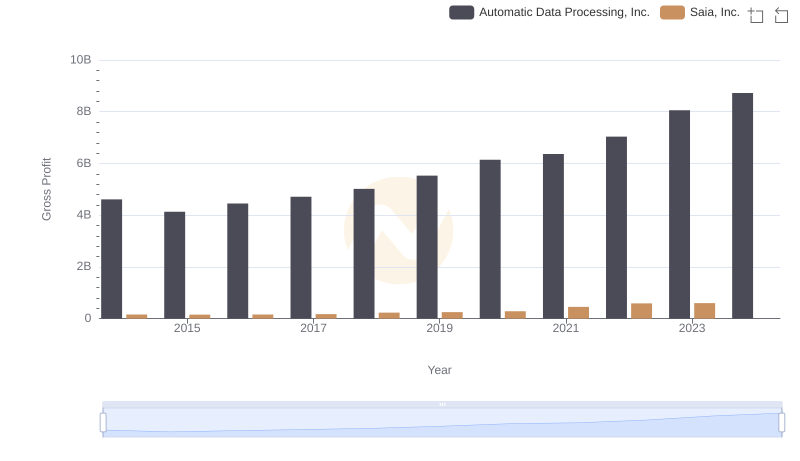
Automatic Data Processing, Inc. and Saia, Inc.: A Detailed Gross Profit Analysis

Key Insights on Gross Profit: Automatic Data Processing, Inc. vs AECOM
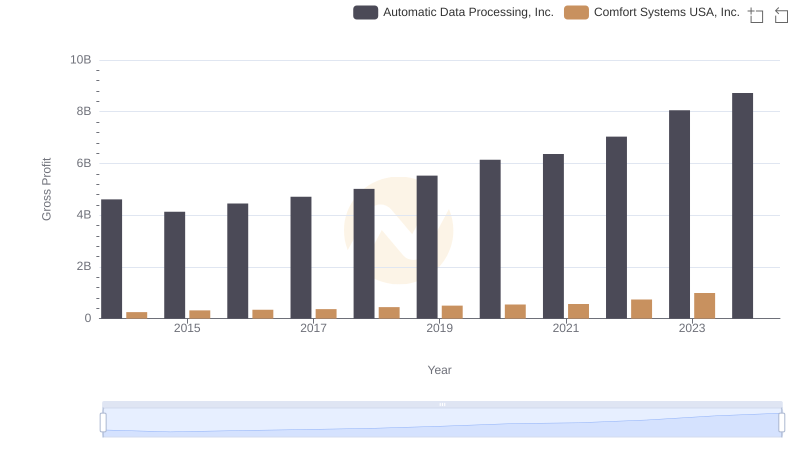
Gross Profit Comparison: Automatic Data Processing, Inc. and Comfort Systems USA, Inc. Trends
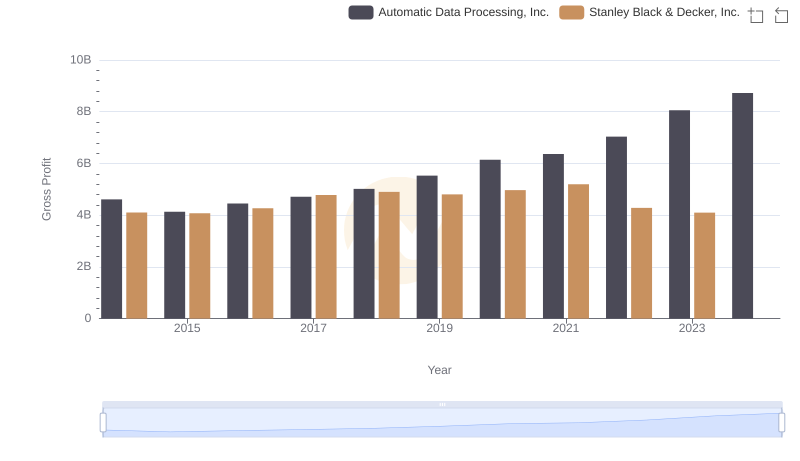
Key Insights on Gross Profit: Automatic Data Processing, Inc. vs Stanley Black & Decker, Inc.
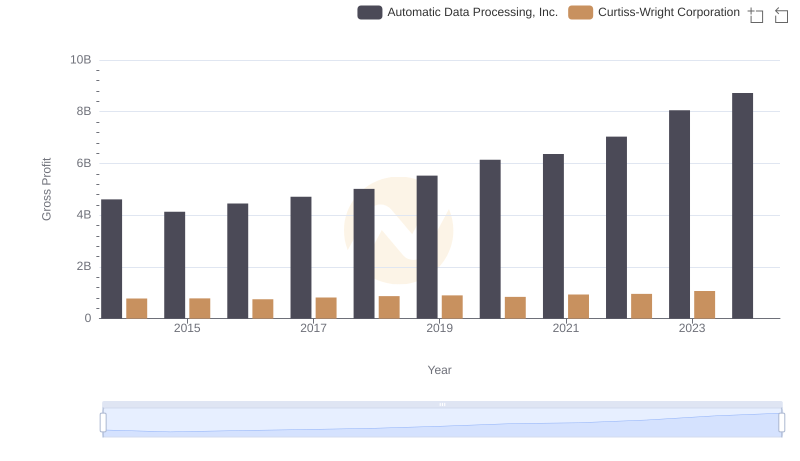
Who Generates Higher Gross Profit? Automatic Data Processing, Inc. or Curtiss-Wright Corporation
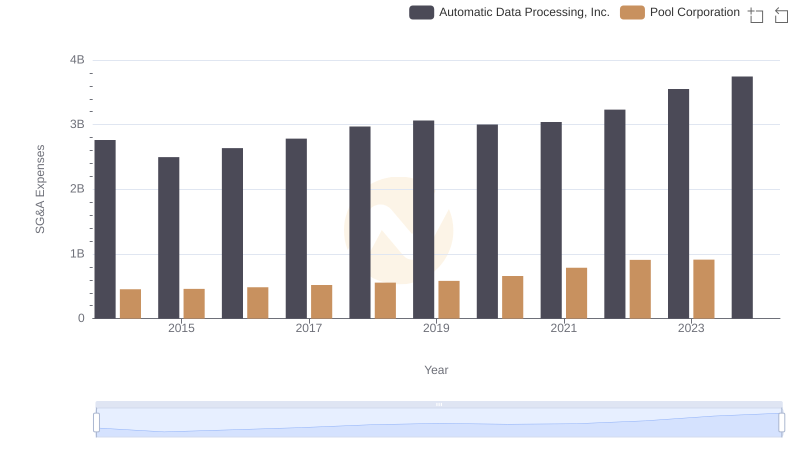
Cost Management Insights: SG&A Expenses for Automatic Data Processing, Inc. and Pool Corporation
Professional EBITDA Benchmarking: Automatic Data Processing, Inc. vs Pool Corporation