| __timestamp | Automatic Data Processing, Inc. | Clean Harbors, Inc. |
|---|---|---|
| Wednesday, January 1, 2014 | 11832800000 | 3401636000 |
| Thursday, January 1, 2015 | 10560800000 | 3275137000 |
| Friday, January 1, 2016 | 11290500000 | 2755226000 |
| Sunday, January 1, 2017 | 11982400000 | 2944978000 |
| Monday, January 1, 2018 | 12859300000 | 3300303000 |
| Tuesday, January 1, 2019 | 13613300000 | 3412190000 |
| Wednesday, January 1, 2020 | 14589800000 | 3144097000 |
| Friday, January 1, 2021 | 15005400000 | 3805566000 |
| Saturday, January 1, 2022 | 16498300000 | 5166605000 |
| Sunday, January 1, 2023 | 18012200000 | 5409152000 |
| Monday, January 1, 2024 | 19202600000 | 5889952000 |
Data in motion
In the ever-evolving landscape of corporate America, Automatic Data Processing, Inc. (ADP) and Clean Harbors, Inc. have showcased intriguing revenue trajectories over the past decade. From 2014 to 2023, ADP's revenue surged by approximately 62%, reflecting its robust growth strategy and market adaptability. In contrast, Clean Harbors, Inc. experienced a more modest increase of around 59% during the same period, highlighting its steady yet resilient market presence.
While 2024 data for Clean Harbors remains elusive, ADP's continued ascent to $19.2 billion suggests a promising future.
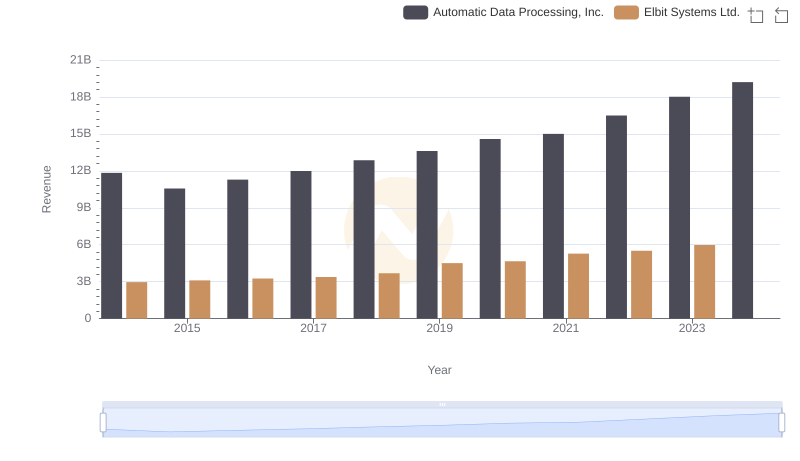
Annual Revenue Comparison: Automatic Data Processing, Inc. vs Elbit Systems Ltd.

Annual Revenue Comparison: Automatic Data Processing, Inc. vs C.H. Robinson Worldwide, Inc.
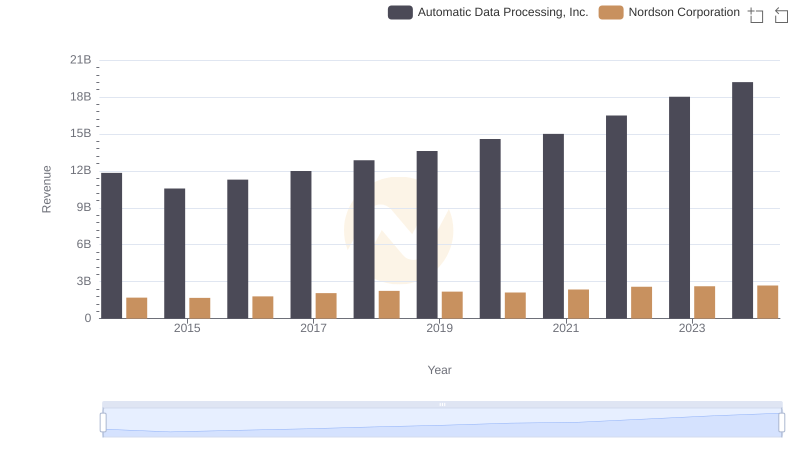
Who Generates More Revenue? Automatic Data Processing, Inc. or Nordson Corporation
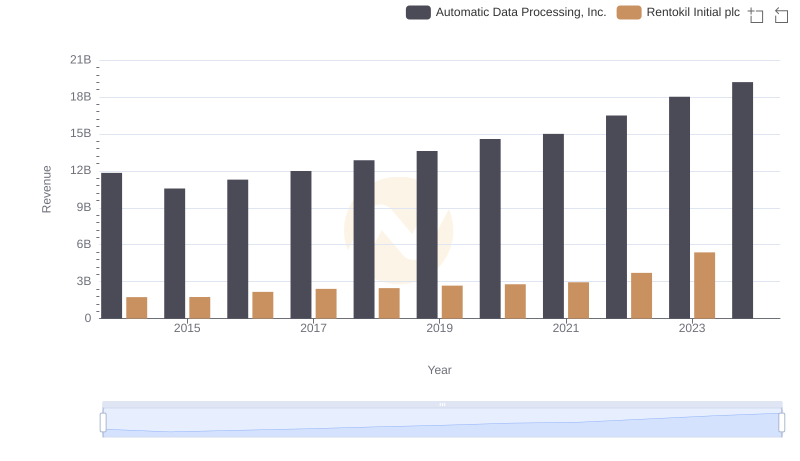
Annual Revenue Comparison: Automatic Data Processing, Inc. vs Rentokil Initial plc
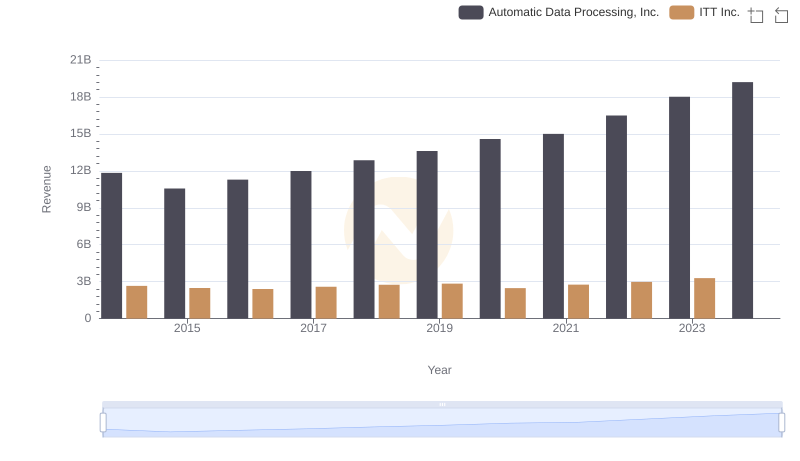
Automatic Data Processing, Inc. and ITT Inc.: A Comprehensive Revenue Analysis
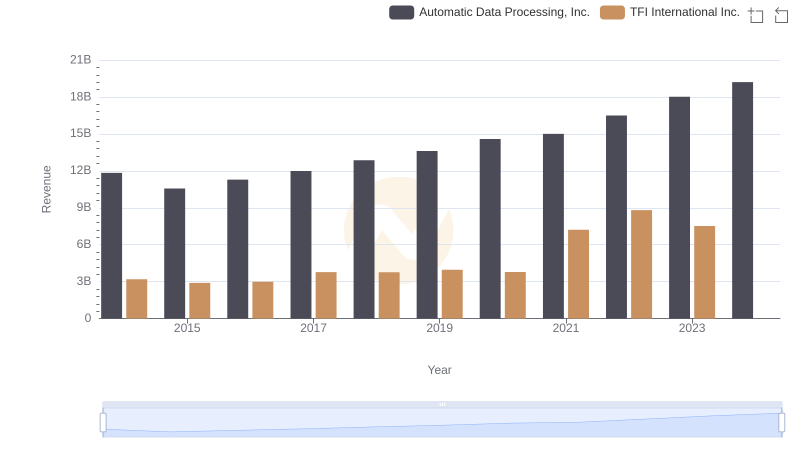
Comparing Revenue Performance: Automatic Data Processing, Inc. or TFI International Inc.?
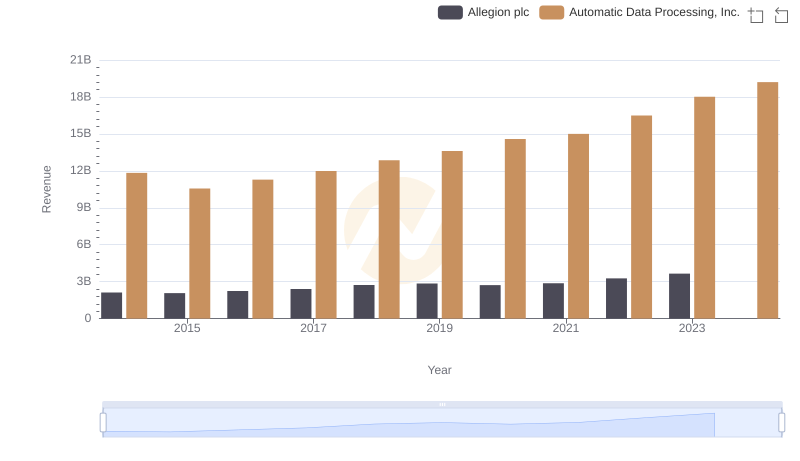
Automatic Data Processing, Inc. and Allegion plc: A Comprehensive Revenue Analysis
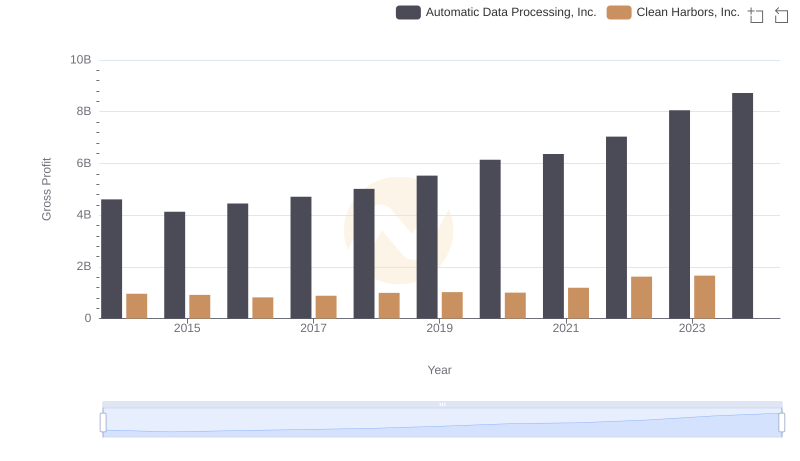
Gross Profit Trends Compared: Automatic Data Processing, Inc. vs Clean Harbors, Inc.
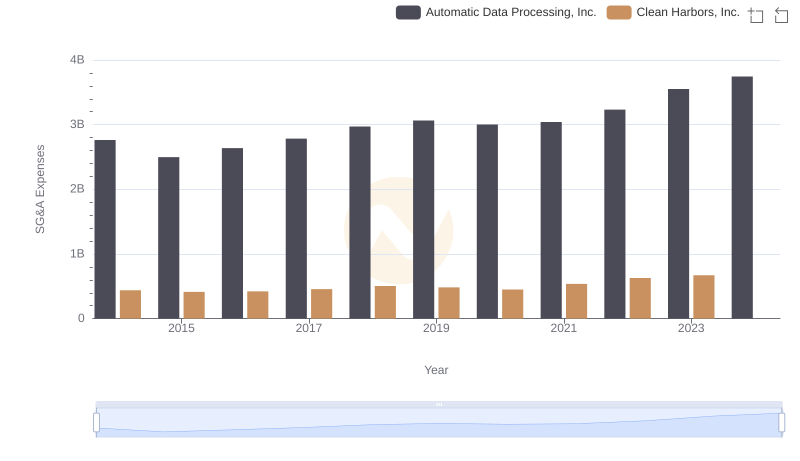
Automatic Data Processing, Inc. and Clean Harbors, Inc.: SG&A Spending Patterns Compared
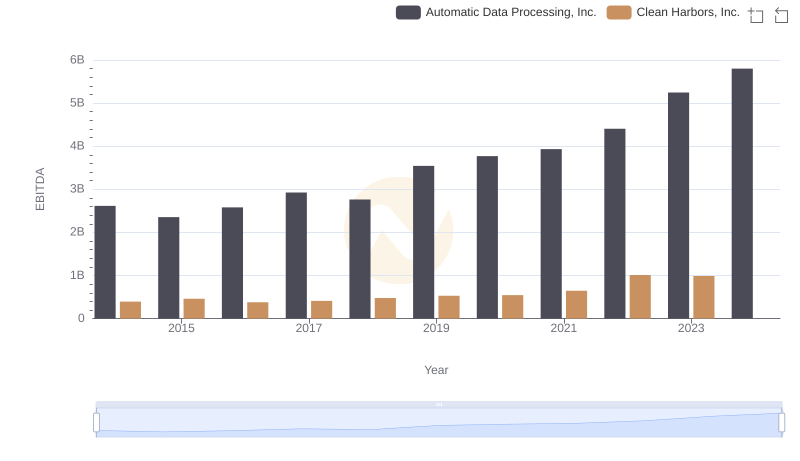
EBITDA Performance Review: Automatic Data Processing, Inc. vs Clean Harbors, Inc.