| __timestamp | Builders FirstSource, Inc. | Parker-Hannifin Corporation |
|---|---|---|
| Wednesday, January 1, 2014 | 1604096000 | 13215971000 |
| Thursday, January 1, 2015 | 3564425000 | 12711744000 |
| Friday, January 1, 2016 | 6367284000 | 11360753000 |
| Sunday, January 1, 2017 | 7034209000 | 12029312000 |
| Monday, January 1, 2018 | 7724771000 | 14302392000 |
| Tuesday, January 1, 2019 | 7280431000 | 14320324000 |
| Wednesday, January 1, 2020 | 8558874000 | 13695520000 |
| Friday, January 1, 2021 | 19893856000 | 14347640000 |
| Saturday, January 1, 2022 | 22726418000 | 15861608000 |
| Sunday, January 1, 2023 | 17097330000 | 19065194000 |
| Monday, January 1, 2024 | 19929606000 |
Unleashing the power of data
In the ever-evolving landscape of industrial and construction sectors, Parker-Hannifin Corporation and Builders FirstSource, Inc. have emerged as formidable players. Over the past decade, Parker-Hannifin has consistently demonstrated robust growth, with its revenue peaking at nearly $20 billion in 2024, marking a 50% increase since 2014. Meanwhile, Builders FirstSource has shown an even more dramatic rise, with its revenue surging by over 1,000% from 2014 to 2022, before experiencing a slight dip in 2023.
This comparison highlights the dynamic nature of these industries, where innovation and strategic acquisitions play pivotal roles. While Parker-Hannifin's steady growth underscores its resilience, Builders FirstSource's rapid ascent reflects its aggressive expansion strategy. As we look to the future, the absence of data for Builders FirstSource in 2024 leaves us eagerly anticipating their next move.

Who Generates More Revenue? Parker-Hannifin Corporation or Dover Corporation
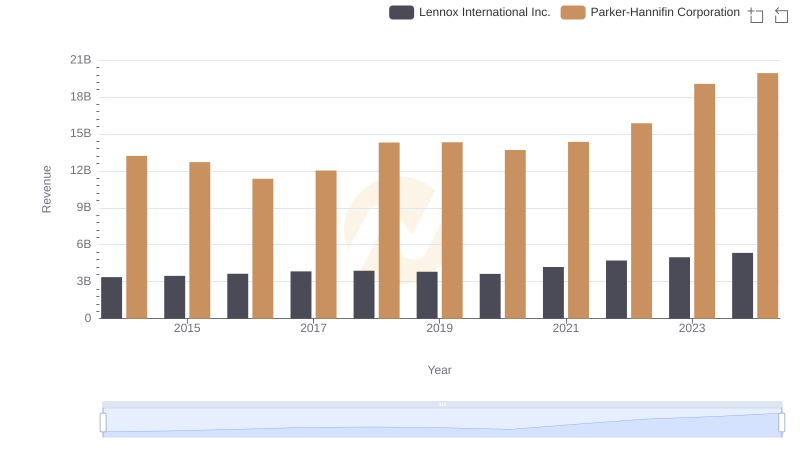
Annual Revenue Comparison: Parker-Hannifin Corporation vs Lennox International Inc.
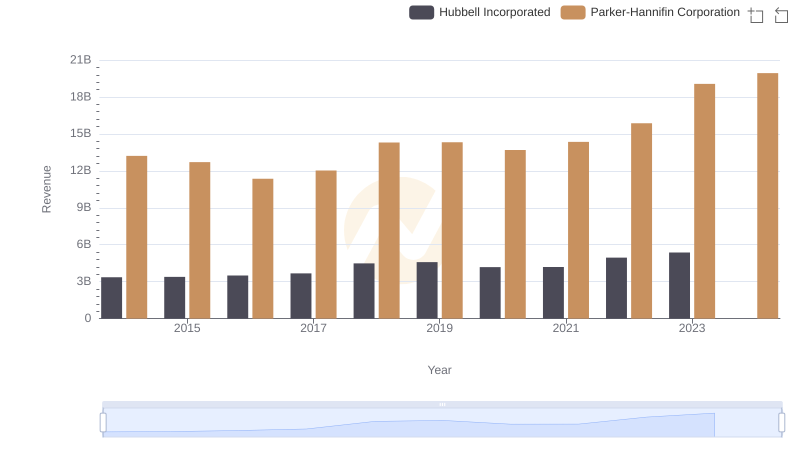
Parker-Hannifin Corporation or Hubbell Incorporated: Who Leads in Yearly Revenue?
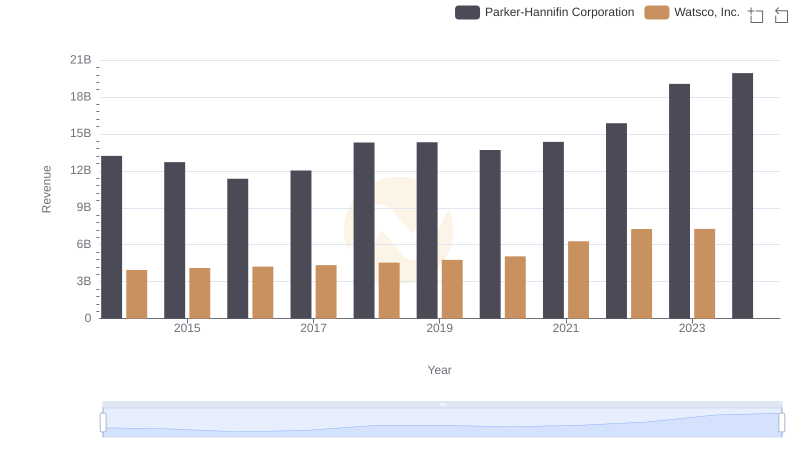
Who Generates More Revenue? Parker-Hannifin Corporation or Watsco, Inc.
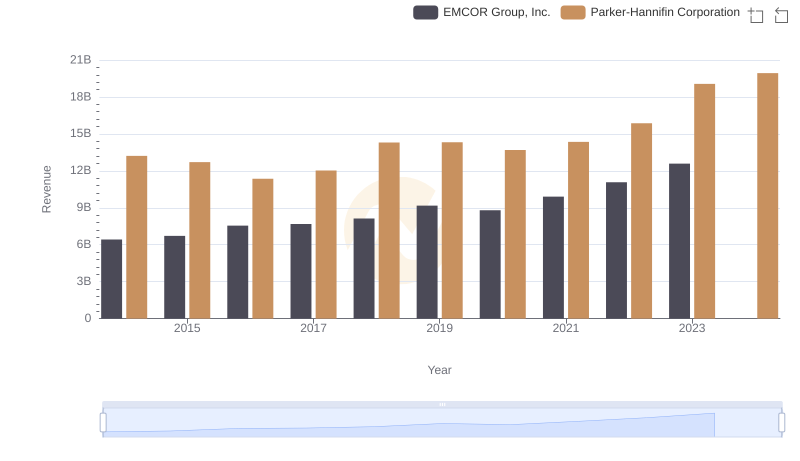
Who Generates More Revenue? Parker-Hannifin Corporation or EMCOR Group, Inc.
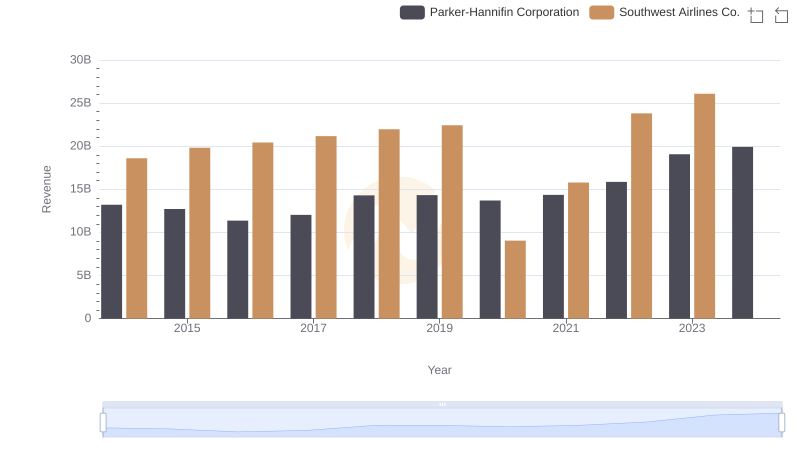
Parker-Hannifin Corporation vs Southwest Airlines Co.: Examining Key Revenue Metrics
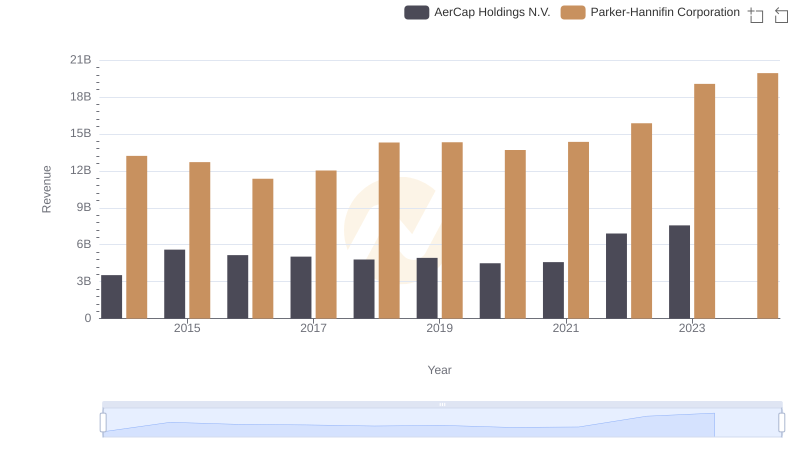
Annual Revenue Comparison: Parker-Hannifin Corporation vs AerCap Holdings N.V.

Analyzing Cost of Revenue: Parker-Hannifin Corporation and Builders FirstSource, Inc.
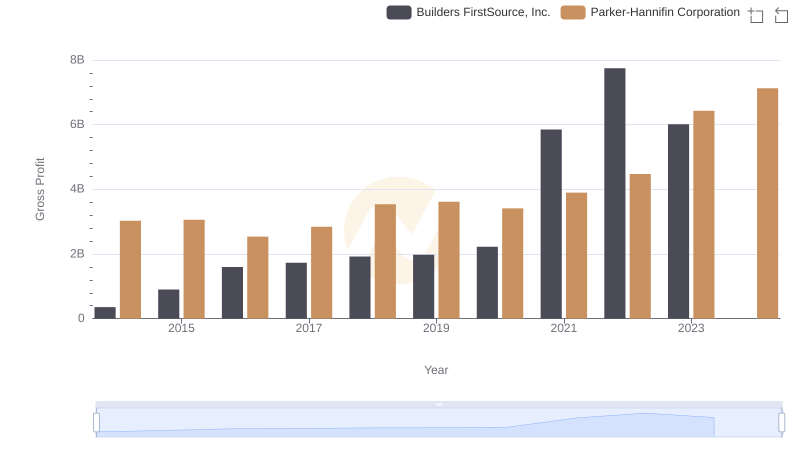
Parker-Hannifin Corporation and Builders FirstSource, Inc.: A Detailed Gross Profit Analysis
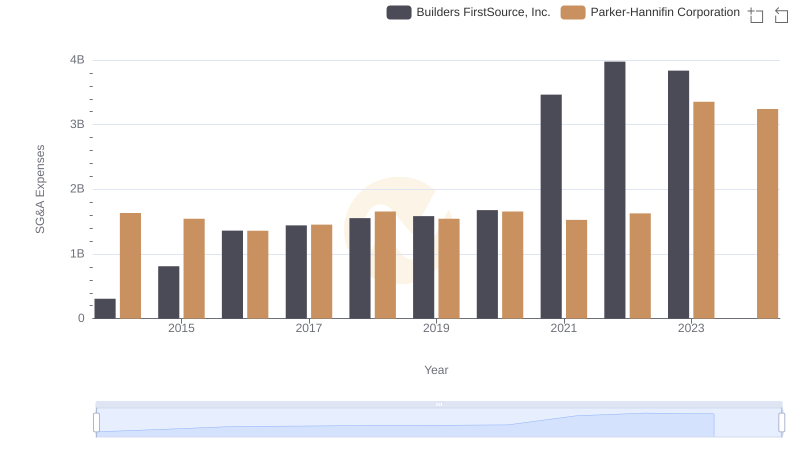
Comparing SG&A Expenses: Parker-Hannifin Corporation vs Builders FirstSource, Inc. Trends and Insights