| __timestamp | Lennox International Inc. | Parker-Hannifin Corporation |
|---|---|---|
| Wednesday, January 1, 2014 | 3367400000 | 13215971000 |
| Thursday, January 1, 2015 | 3467400000 | 12711744000 |
| Friday, January 1, 2016 | 3641600000 | 11360753000 |
| Sunday, January 1, 2017 | 3839600000 | 12029312000 |
| Monday, January 1, 2018 | 3883900000 | 14302392000 |
| Tuesday, January 1, 2019 | 3807200000 | 14320324000 |
| Wednesday, January 1, 2020 | 3634100000 | 13695520000 |
| Friday, January 1, 2021 | 4194100000 | 14347640000 |
| Saturday, January 1, 2022 | 4718400000 | 15861608000 |
| Sunday, January 1, 2023 | 4981900000 | 19065194000 |
| Monday, January 1, 2024 | 5341300000 | 19929606000 |
Unlocking the unknown
In the ever-evolving landscape of industrial manufacturing, Parker-Hannifin Corporation and Lennox International Inc. have emerged as formidable players. Over the past decade, Parker-Hannifin has consistently outpaced Lennox in revenue, boasting a staggering 200% higher revenue on average. From 2014 to 2024, Parker-Hannifin's revenue surged by approximately 51%, reaching nearly $20 billion in 2024. In contrast, Lennox International experienced a 59% increase, culminating in a revenue of over $5 billion in the same year.
This growth trajectory highlights Parker-Hannifin's robust market position and strategic expansions, while Lennox's steady climb underscores its resilience and adaptability in a competitive market. As we look to the future, these trends offer valuable insights into the industrial sector's dynamics, where innovation and strategic foresight remain key to sustained success.
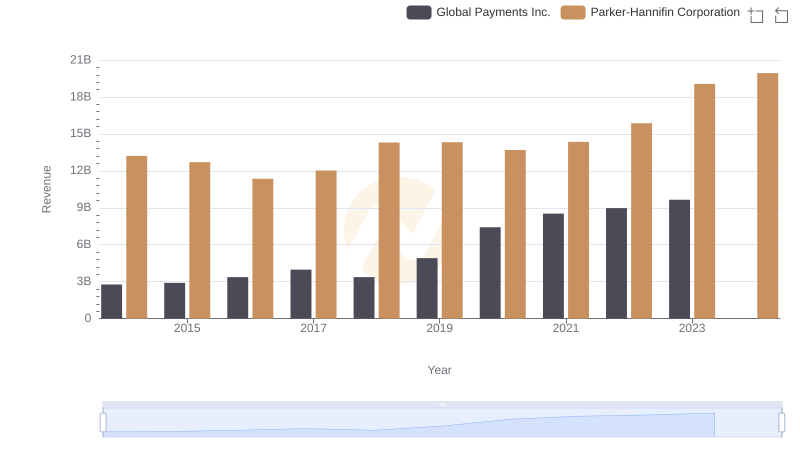
Annual Revenue Comparison: Parker-Hannifin Corporation vs Global Payments Inc.

Who Generates More Revenue? Parker-Hannifin Corporation or Dover Corporation
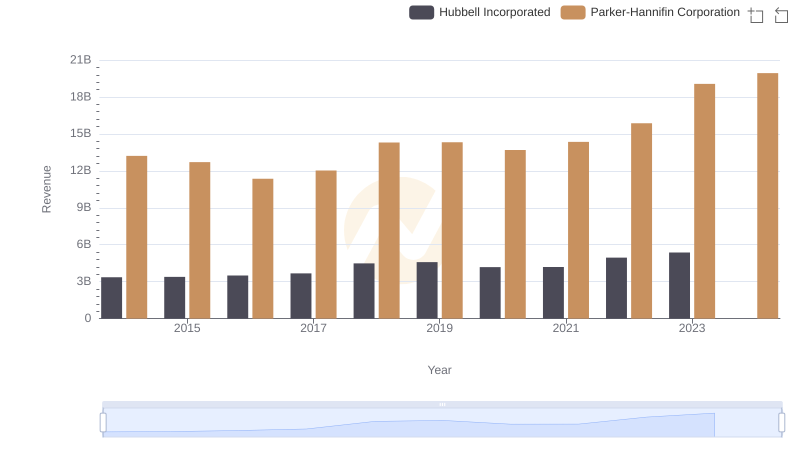
Parker-Hannifin Corporation or Hubbell Incorporated: Who Leads in Yearly Revenue?
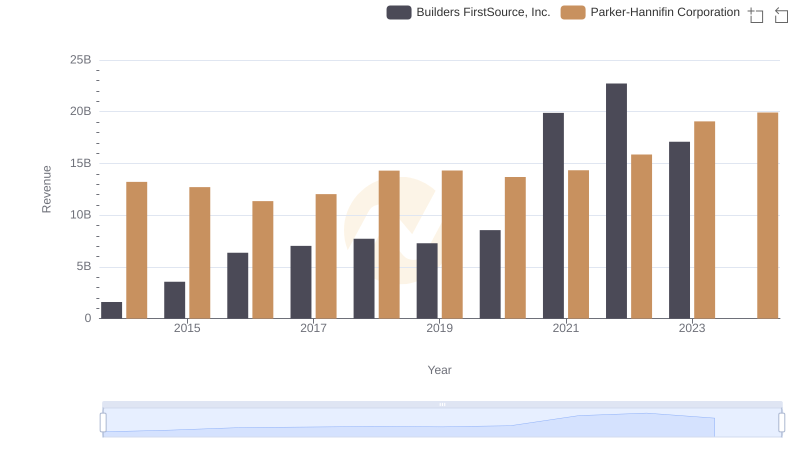
Annual Revenue Comparison: Parker-Hannifin Corporation vs Builders FirstSource, Inc.
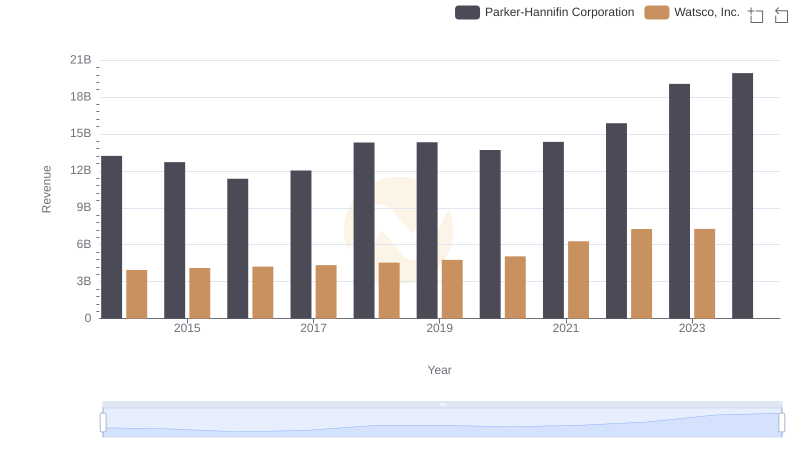
Who Generates More Revenue? Parker-Hannifin Corporation or Watsco, Inc.
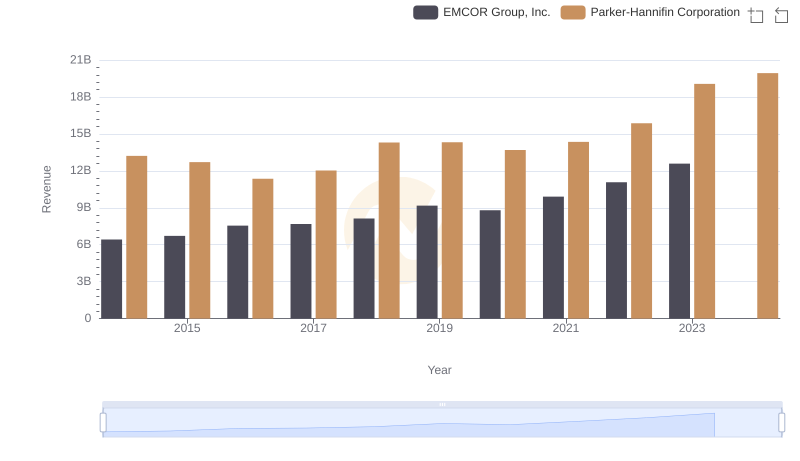
Who Generates More Revenue? Parker-Hannifin Corporation or EMCOR Group, Inc.
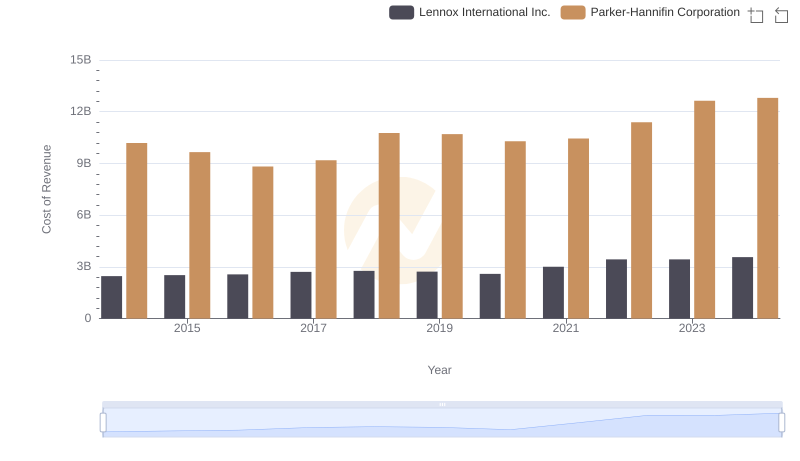
Analyzing Cost of Revenue: Parker-Hannifin Corporation and Lennox International Inc.
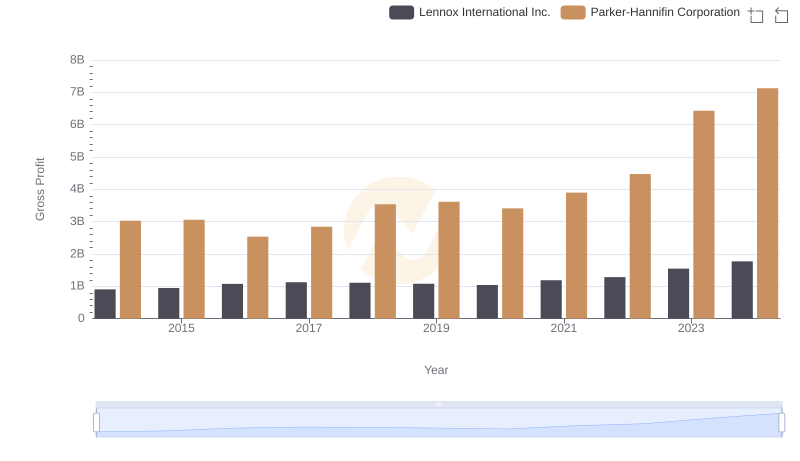
Gross Profit Comparison: Parker-Hannifin Corporation and Lennox International Inc. Trends
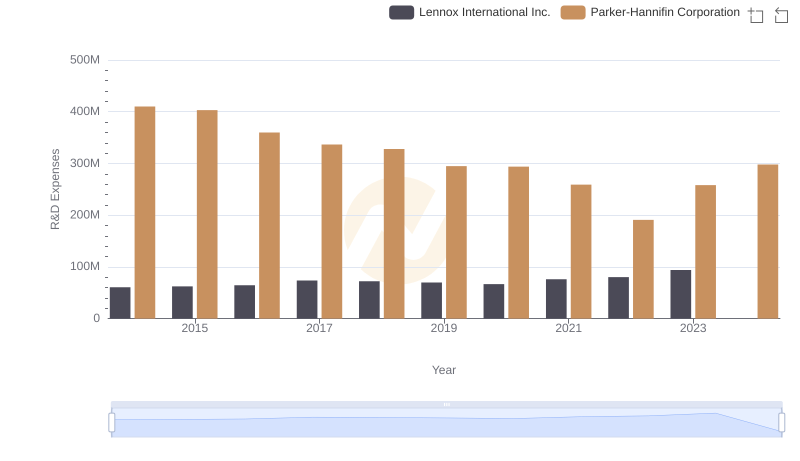
Research and Development: Comparing Key Metrics for Parker-Hannifin Corporation and Lennox International Inc.
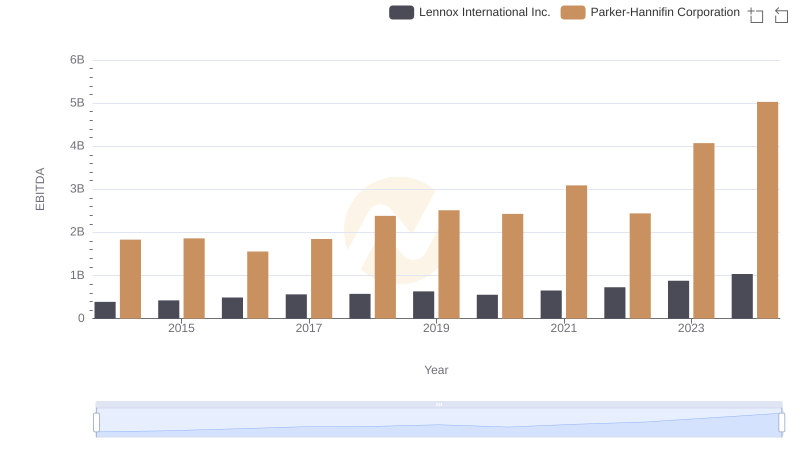
Professional EBITDA Benchmarking: Parker-Hannifin Corporation vs Lennox International Inc.