| __timestamp | Hubbell Incorporated | Parker-Hannifin Corporation |
|---|---|---|
| Wednesday, January 1, 2014 | 3359400000 | 13215971000 |
| Thursday, January 1, 2015 | 3390400000 | 12711744000 |
| Friday, January 1, 2016 | 3505200000 | 11360753000 |
| Sunday, January 1, 2017 | 3668800000 | 12029312000 |
| Monday, January 1, 2018 | 4481700000 | 14302392000 |
| Tuesday, January 1, 2019 | 4591000000 | 14320324000 |
| Wednesday, January 1, 2020 | 4186000000 | 13695520000 |
| Friday, January 1, 2021 | 4194100000 | 14347640000 |
| Saturday, January 1, 2022 | 4947900000 | 15861608000 |
| Sunday, January 1, 2023 | 5372900000 | 19065194000 |
| Monday, January 1, 2024 | 5628500000 | 19929606000 |
Unlocking the unknown
In the competitive landscape of industrial manufacturing, Parker-Hannifin Corporation and Hubbell Incorporated have been key players. Over the past decade, Parker-Hannifin has consistently outpaced Hubbell in annual revenue. From 2014 to 2023, Parker-Hannifin's revenue grew by approximately 44%, reaching nearly $19 billion in 2023. In contrast, Hubbell's revenue increased by about 60% during the same period, peaking at over $5 billion in 2023. Despite Hubbell's impressive growth rate, Parker-Hannifin's revenue remains nearly three times larger. This revenue gap highlights Parker-Hannifin's dominant market position. However, the missing data for 2024 suggests that the future could hold surprises. As both companies continue to innovate and expand, the industrial sector eagerly watches to see if Hubbell can close the gap or if Parker-Hannifin will further solidify its lead.
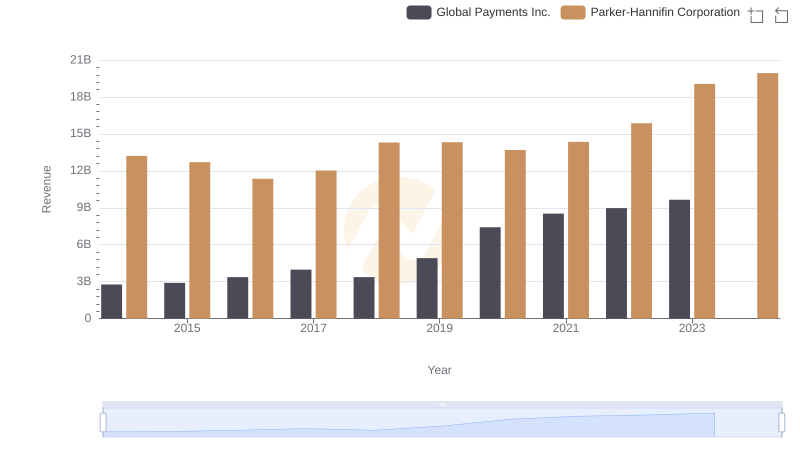
Annual Revenue Comparison: Parker-Hannifin Corporation vs Global Payments Inc.

Who Generates More Revenue? Parker-Hannifin Corporation or Dover Corporation
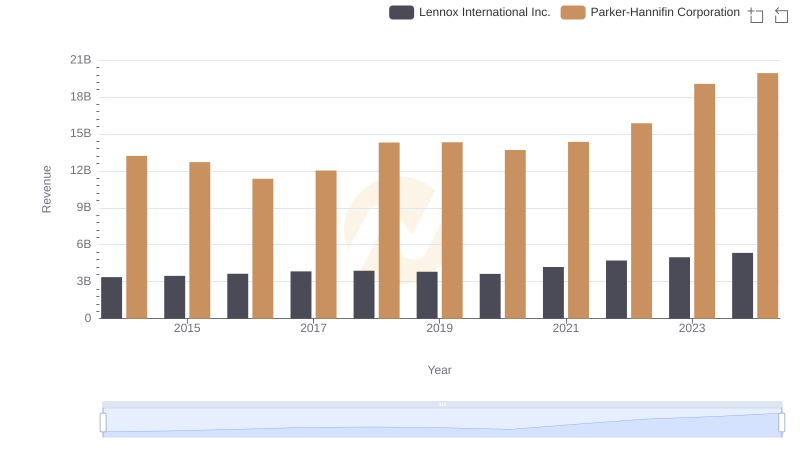
Annual Revenue Comparison: Parker-Hannifin Corporation vs Lennox International Inc.
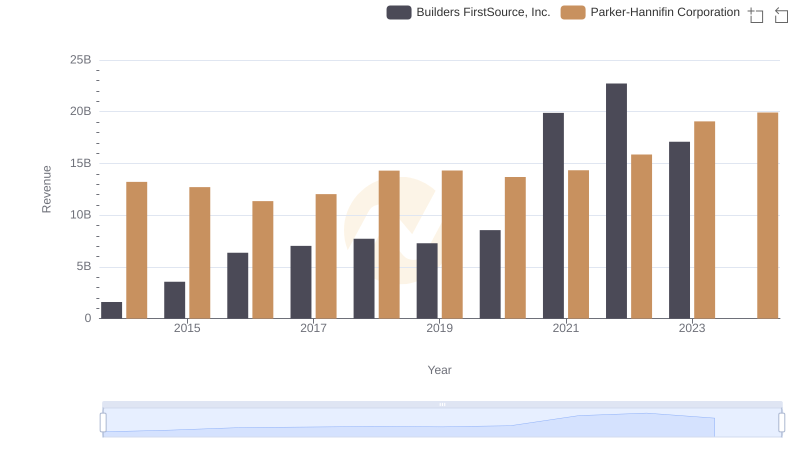
Annual Revenue Comparison: Parker-Hannifin Corporation vs Builders FirstSource, Inc.
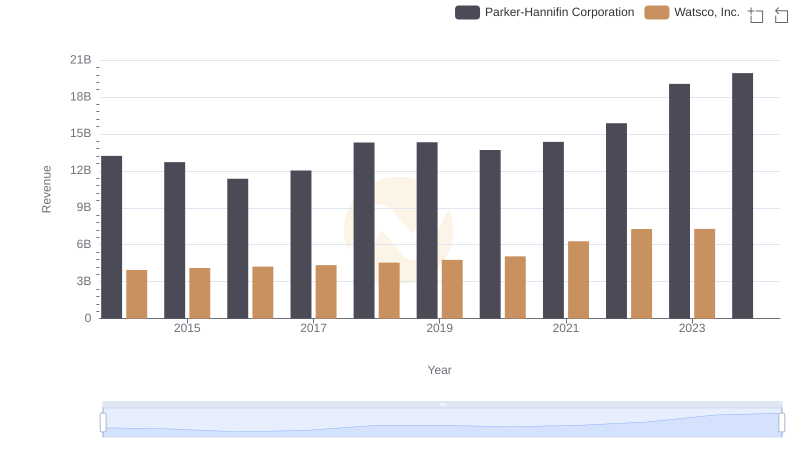
Who Generates More Revenue? Parker-Hannifin Corporation or Watsco, Inc.
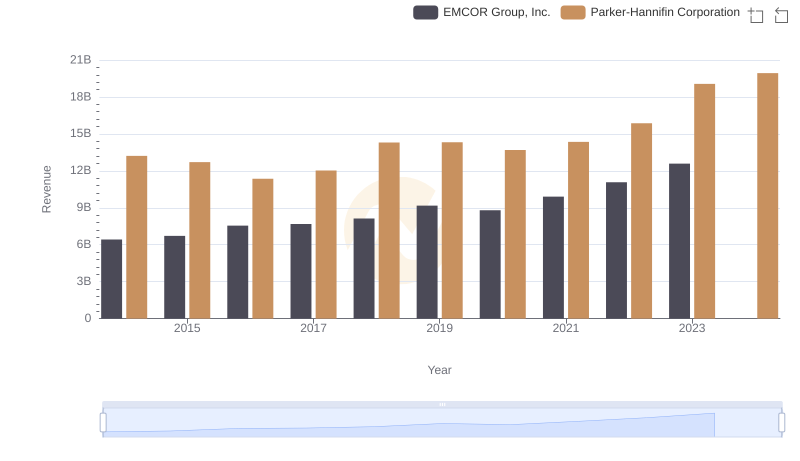
Who Generates More Revenue? Parker-Hannifin Corporation or EMCOR Group, Inc.
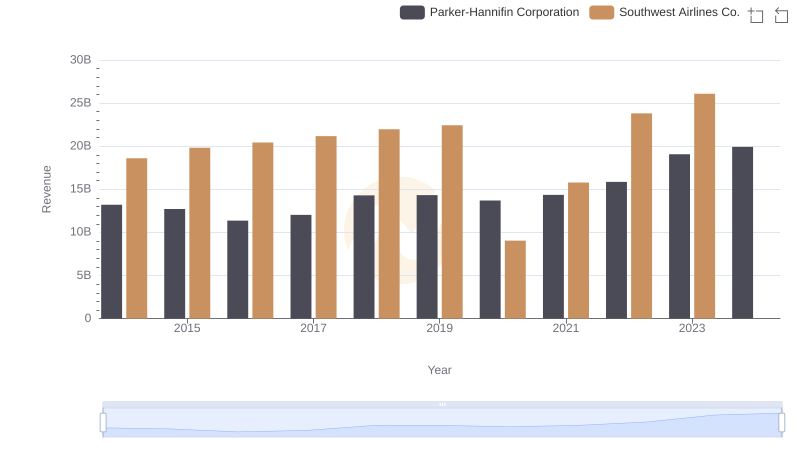
Parker-Hannifin Corporation vs Southwest Airlines Co.: Examining Key Revenue Metrics
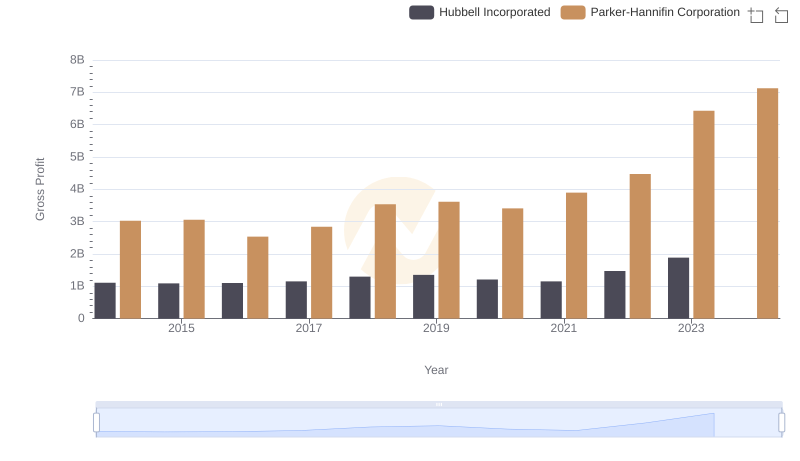
Gross Profit Comparison: Parker-Hannifin Corporation and Hubbell Incorporated Trends
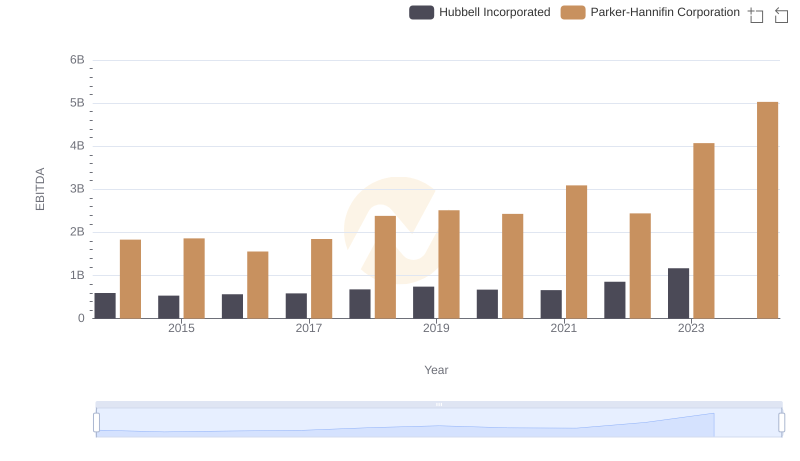
EBITDA Performance Review: Parker-Hannifin Corporation vs Hubbell Incorporated