| __timestamp | Ferrovial SE | Parker-Hannifin Corporation |
|---|---|---|
| Wednesday, January 1, 2014 | 8802000000 | 13215971000 |
| Thursday, January 1, 2015 | 9699000000 | 12711744000 |
| Friday, January 1, 2016 | 10758000000 | 11360753000 |
| Sunday, January 1, 2017 | 12209000000 | 12029312000 |
| Monday, January 1, 2018 | 5737000000 | 14302392000 |
| Tuesday, January 1, 2019 | 6054000000 | 14320324000 |
| Wednesday, January 1, 2020 | 6341000000 | 13695520000 |
| Friday, January 1, 2021 | 6778000000 | 14347640000 |
| Saturday, January 1, 2022 | 7551000000 | 15861608000 |
| Sunday, January 1, 2023 | 8514000000 | 19065194000 |
| Monday, January 1, 2024 | 19929606000 |
Infusing magic into the data realm
In the ever-evolving landscape of global industry, Parker-Hannifin Corporation and Ferrovial SE stand as titans in their respective fields. Over the past decade, Parker-Hannifin has consistently outperformed Ferrovial SE in terms of revenue, showcasing a robust growth trajectory. From 2014 to 2023, Parker-Hannifin's revenue surged by approximately 44%, peaking at nearly $19 billion in 2023. In contrast, Ferrovial SE experienced a more modest growth of around 3% over the same period, with revenues fluctuating between $5.7 billion and $12.2 billion.
The data reveals a significant dip in Ferrovial SE's revenue in 2018, dropping to $5.7 billion, while Parker-Hannifin continued its upward trend. This divergence highlights the resilience and strategic prowess of Parker-Hannifin in navigating market challenges. As we look to the future, the absence of Ferrovial SE's 2024 data leaves room for speculation on its next move in this competitive arena.
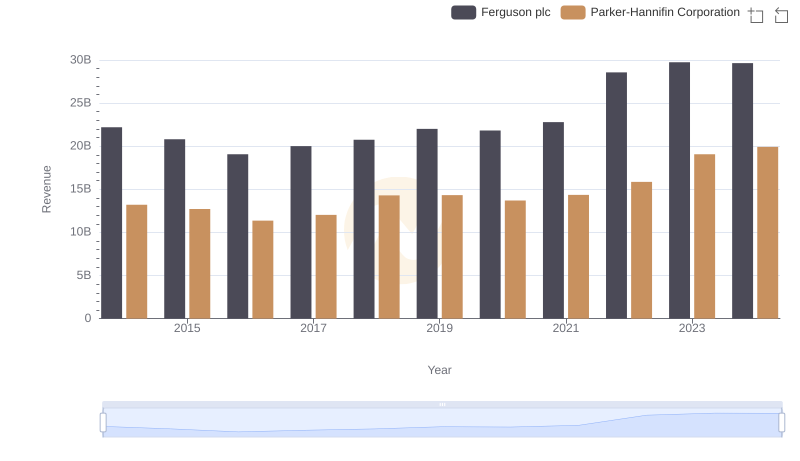
Parker-Hannifin Corporation vs Ferguson plc: Annual Revenue Growth Compared
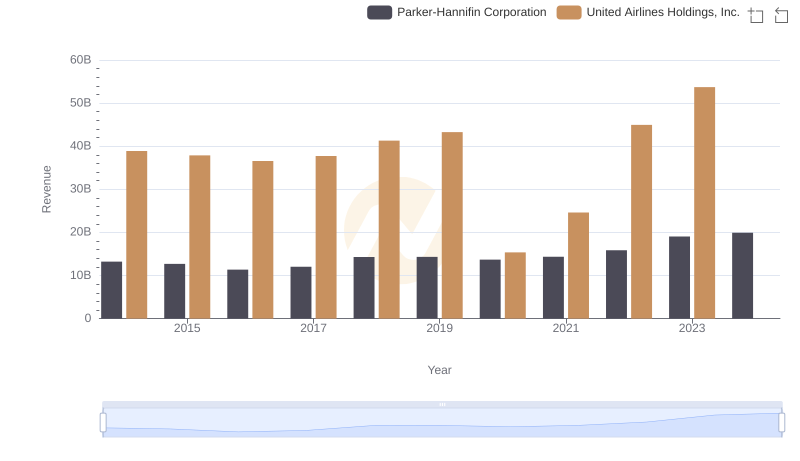
Comparing Revenue Performance: Parker-Hannifin Corporation or United Airlines Holdings, Inc.?
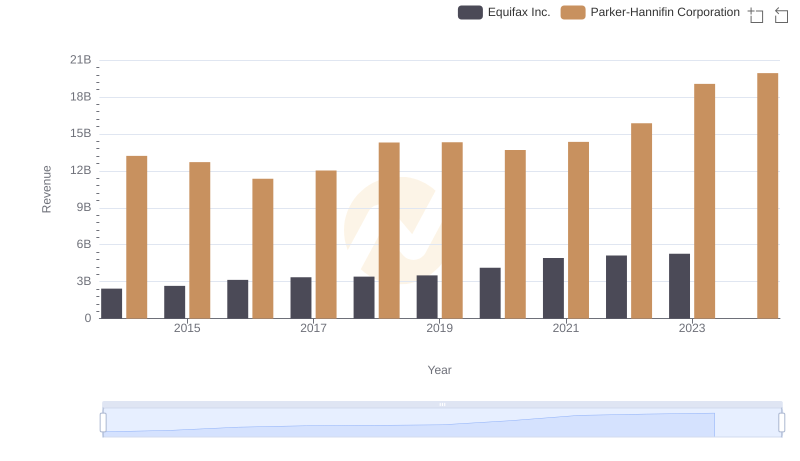
Parker-Hannifin Corporation vs Equifax Inc.: Annual Revenue Growth Compared
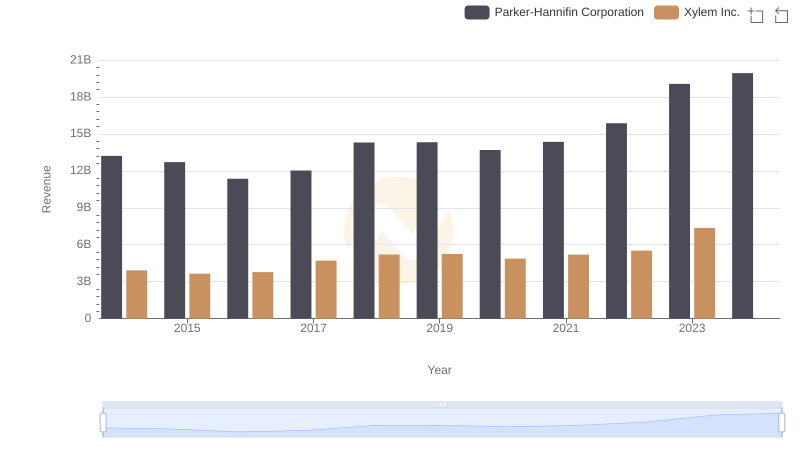
Annual Revenue Comparison: Parker-Hannifin Corporation vs Xylem Inc.
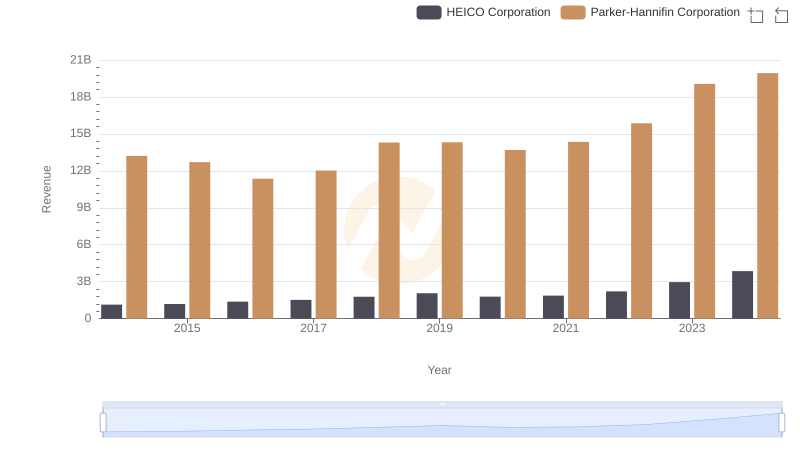
Comparing Revenue Performance: Parker-Hannifin Corporation or HEICO Corporation?
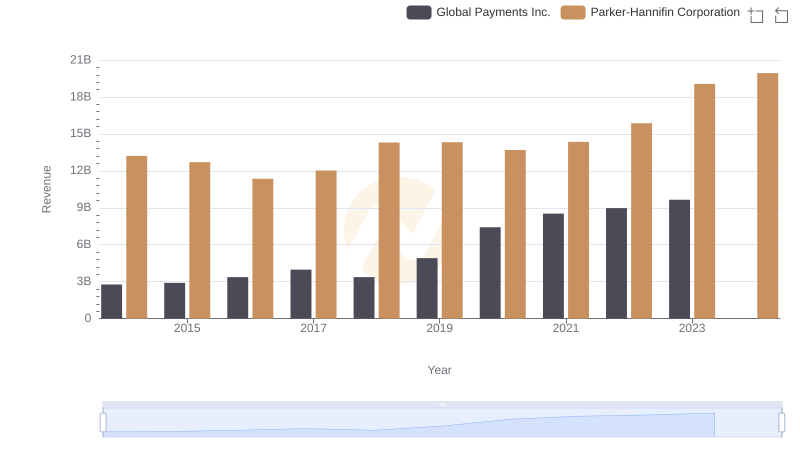
Annual Revenue Comparison: Parker-Hannifin Corporation vs Global Payments Inc.

Who Generates More Revenue? Parker-Hannifin Corporation or Dover Corporation
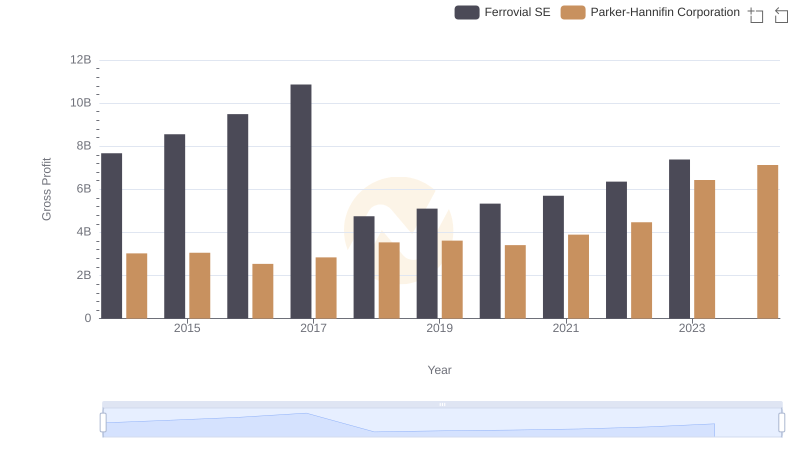
Parker-Hannifin Corporation and Ferrovial SE: A Detailed Gross Profit Analysis
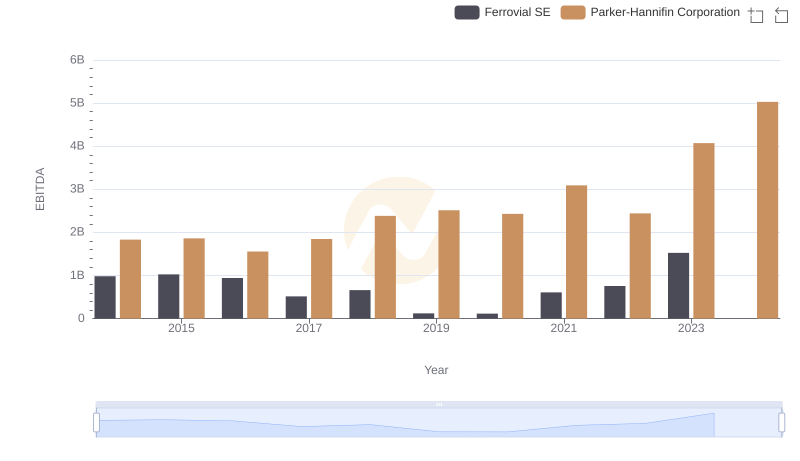
Professional EBITDA Benchmarking: Parker-Hannifin Corporation vs Ferrovial SE