| __timestamp | C.H. Robinson Worldwide, Inc. | Waste Connections, Inc. |
|---|---|---|
| Wednesday, January 1, 2014 | 13470067000 | 2079166000 |
| Thursday, January 1, 2015 | 13476084000 | 2117287000 |
| Friday, January 1, 2016 | 13144413000 | 3375863000 |
| Sunday, January 1, 2017 | 14869380000 | 4630488000 |
| Monday, January 1, 2018 | 16631172000 | 4922941000 |
| Tuesday, January 1, 2019 | 15309508000 | 5388679000 |
| Wednesday, January 1, 2020 | 16207106000 | 5445990000 |
| Friday, January 1, 2021 | 23102138000 | 6151361000 |
| Saturday, January 1, 2022 | 24696625000 | 7211859000 |
| Sunday, January 1, 2023 | 17596443000 | 8021951000 |
| Monday, January 1, 2024 | 17724956000 | 8919591000 |
In pursuit of knowledge
In the competitive landscape of logistics and waste management, C.H. Robinson Worldwide, Inc. and Waste Connections, Inc. have showcased remarkable revenue trajectories over the past decade. Since 2014, C.H. Robinson has seen its revenue grow by approximately 31%, peaking in 2022. This growth underscores its resilience and adaptability in the ever-evolving logistics sector. Meanwhile, Waste Connections has demonstrated an impressive revenue increase of nearly 286% from 2014 to 2023, reflecting its strategic expansions and acquisitions in the waste management industry.
While C.H. Robinson experienced a slight dip in 2023, Waste Connections continued its upward trend, highlighting its robust market position. The data for 2024 remains incomplete, offering a tantalizing glimpse into future possibilities. As these industry leaders forge ahead, their revenue insights provide a fascinating window into their strategic maneuvers and market dynamics.
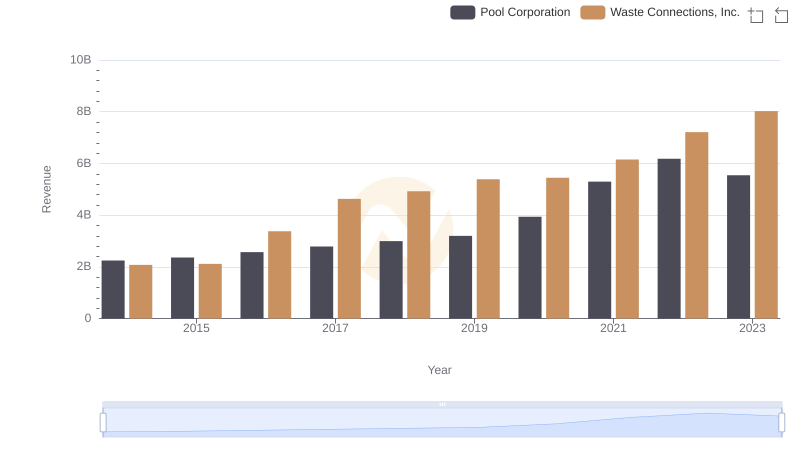
Breaking Down Revenue Trends: Waste Connections, Inc. vs Pool Corporation
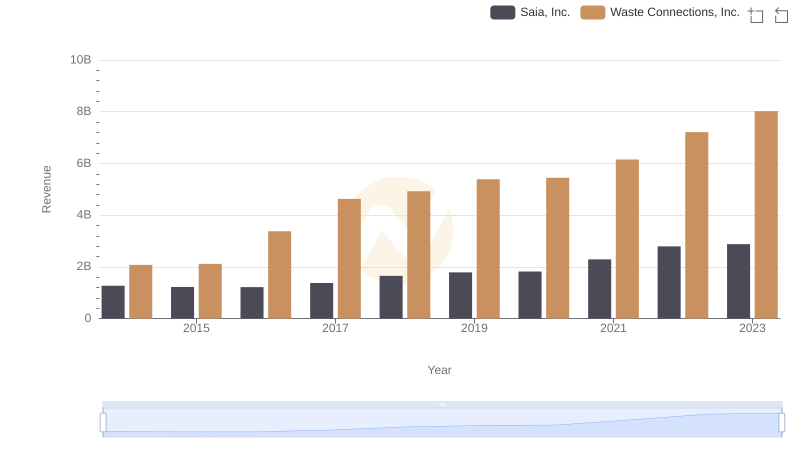
Comparing Revenue Performance: Waste Connections, Inc. or Saia, Inc.?
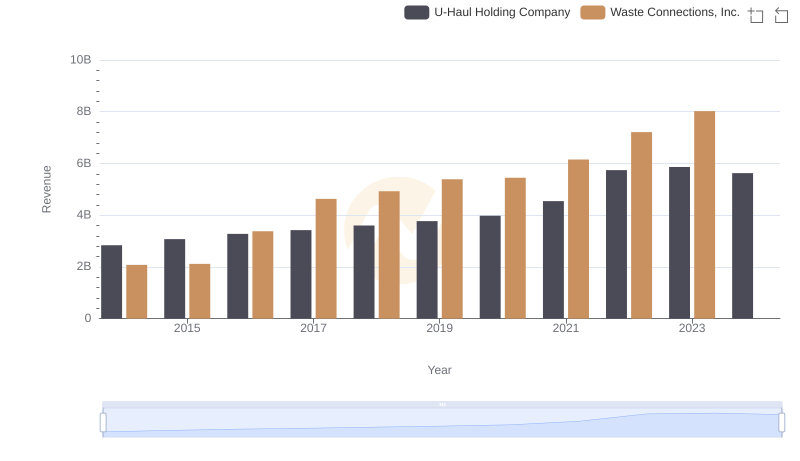
Comparing Revenue Performance: Waste Connections, Inc. or U-Haul Holding Company?
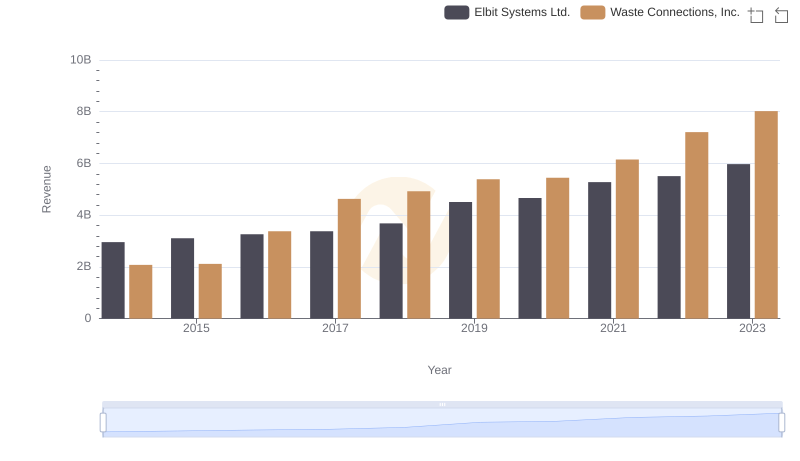
Revenue Showdown: Waste Connections, Inc. vs Elbit Systems Ltd.
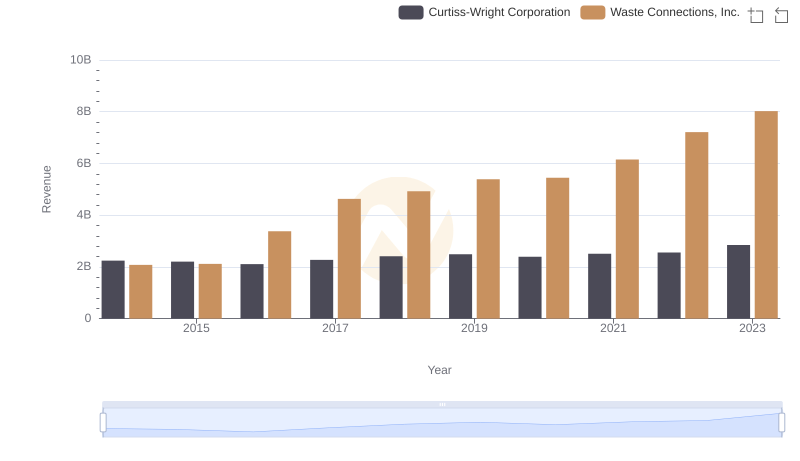
Annual Revenue Comparison: Waste Connections, Inc. vs Curtiss-Wright Corporation
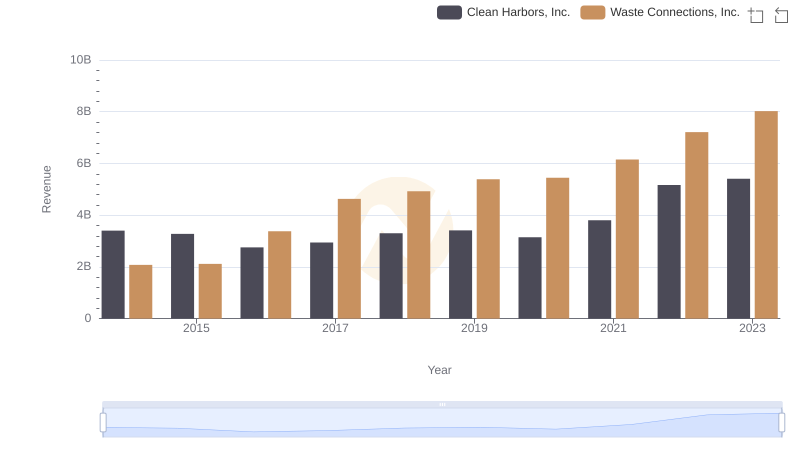
Waste Connections, Inc. or Clean Harbors, Inc.: Who Leads in Yearly Revenue?
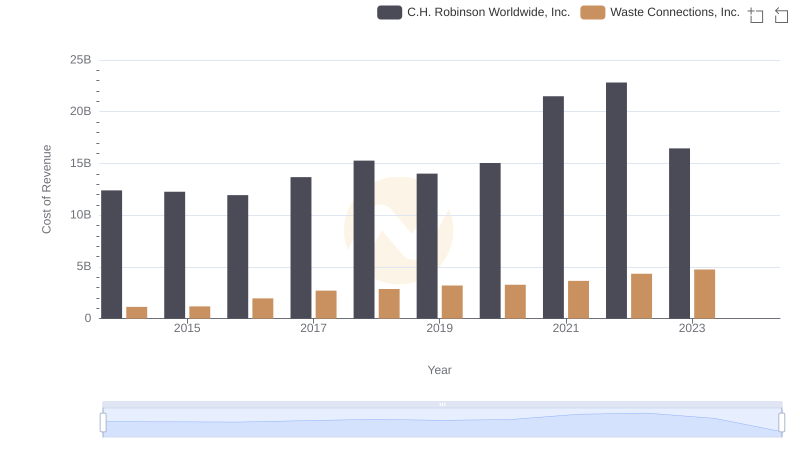
Analyzing Cost of Revenue: Waste Connections, Inc. and C.H. Robinson Worldwide, Inc.
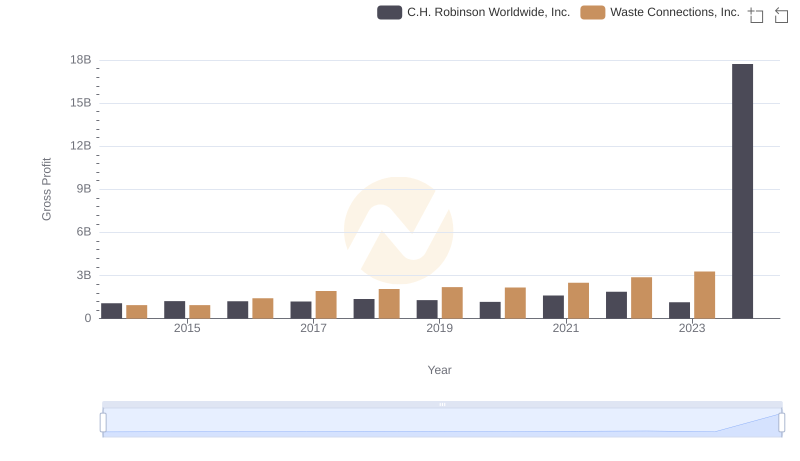
Key Insights on Gross Profit: Waste Connections, Inc. vs C.H. Robinson Worldwide, Inc.
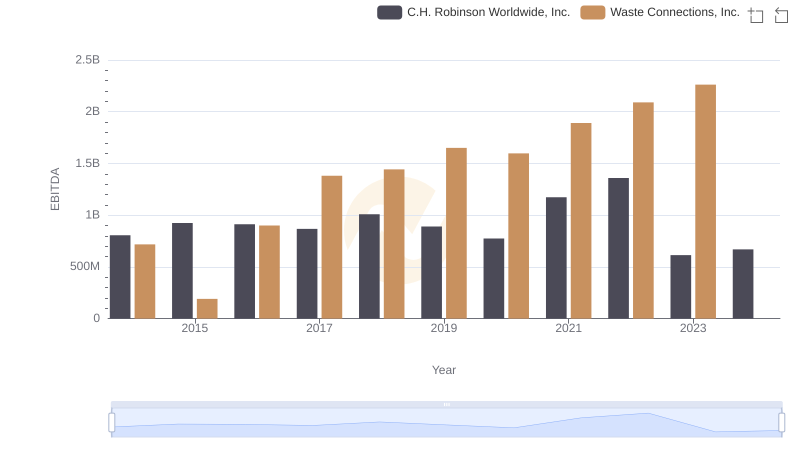
A Professional Review of EBITDA: Waste Connections, Inc. Compared to C.H. Robinson Worldwide, Inc.