| __timestamp | Elbit Systems Ltd. | Ryanair Holdings plc |
|---|---|---|
| Wednesday, January 1, 2014 | 2133151000 | 3838100000 |
| Thursday, January 1, 2015 | 2210528000 | 3999600000 |
| Friday, January 1, 2016 | 2300636000 | 4355900000 |
| Sunday, January 1, 2017 | 2379905000 | 4294000000 |
| Monday, January 1, 2018 | 2707505000 | 4512300000 |
| Tuesday, January 1, 2019 | 3371933000 | 5492800000 |
| Wednesday, January 1, 2020 | 3497465000 | 6039900000 |
| Friday, January 1, 2021 | 3920473000 | 1702700000 |
| Saturday, January 1, 2022 | 4138266000 | 4009800000 |
| Sunday, January 1, 2023 | 4491790000 | 7735000000 |
| Monday, January 1, 2024 | 9566400000 |
Unveiling the hidden dimensions of data
In the ever-evolving landscape of global business, understanding the cost of revenue is crucial for assessing a company's financial health. This analysis delves into the cost of revenue trends for Ryanair Holdings plc and Elbit Systems Ltd. over the past decade.
From 2014 to 2023, Ryanair's cost of revenue has shown a remarkable upward trajectory, peaking at approximately 7.7 billion in 2023. This represents a staggering 101% increase from its 2014 figures, reflecting the airline's aggressive expansion and operational scaling.
Elbit Systems Ltd. has also experienced a steady rise, with its cost of revenue increasing by around 110% from 2014 to 2023. The defense electronics company reached its highest cost of revenue in 2023, underscoring its robust market presence.
While the data for 2024 is incomplete for Elbit Systems Ltd., Ryanair's figures continue to soar, hinting at further growth.
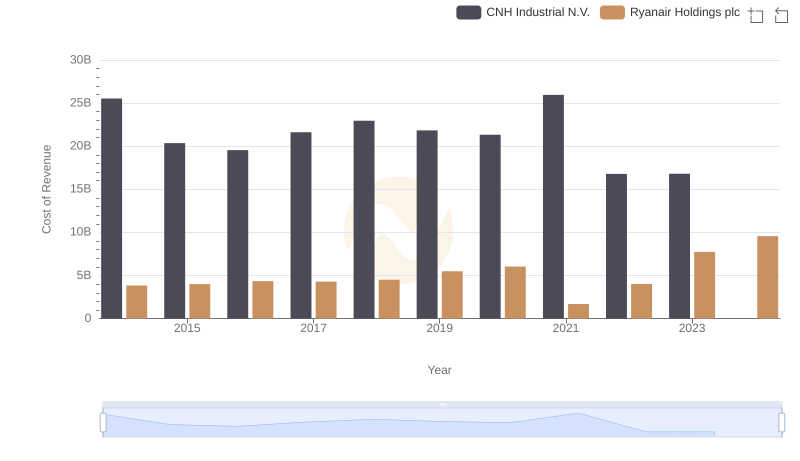
Analyzing Cost of Revenue: Ryanair Holdings plc and CNH Industrial N.V.
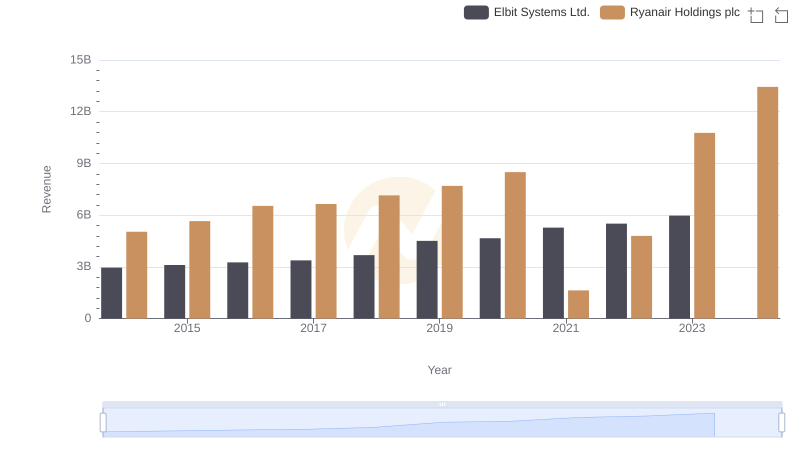
Who Generates More Revenue? Ryanair Holdings plc or Elbit Systems Ltd.
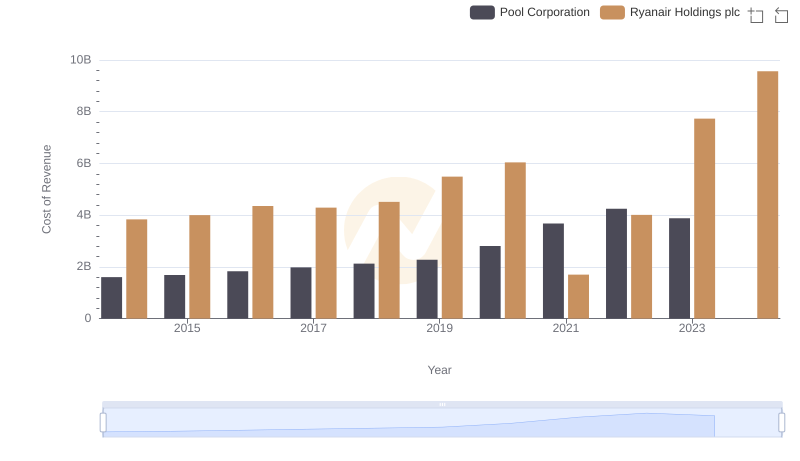
Cost Insights: Breaking Down Ryanair Holdings plc and Pool Corporation's Expenses
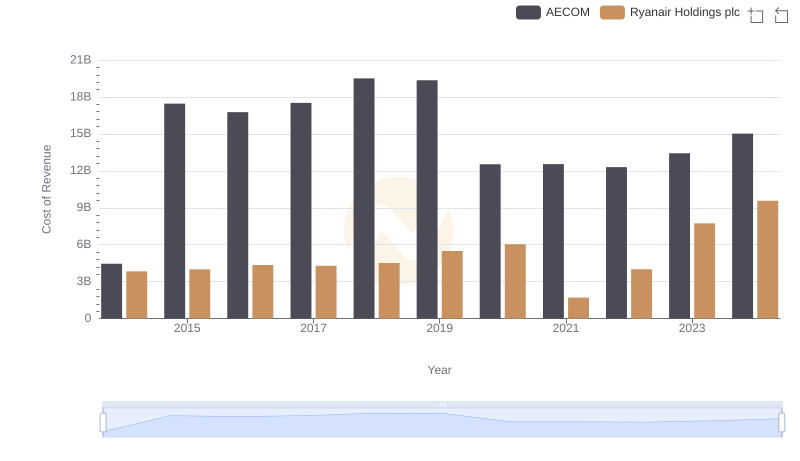
Cost Insights: Breaking Down Ryanair Holdings plc and AECOM's Expenses
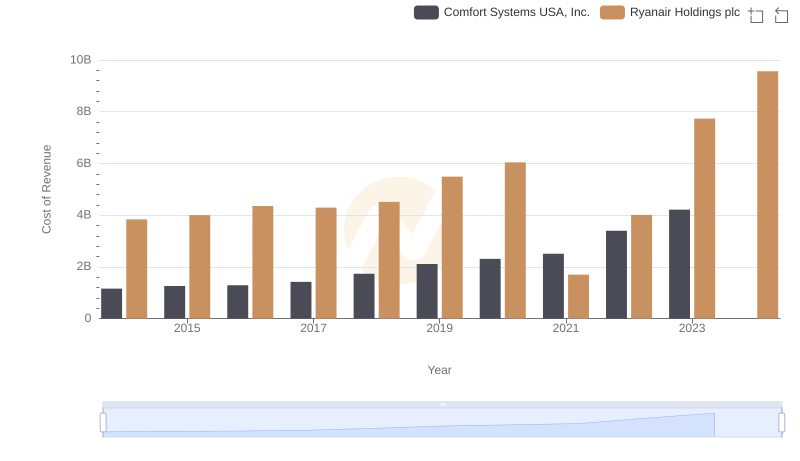
Cost of Revenue Trends: Ryanair Holdings plc vs Comfort Systems USA, Inc.
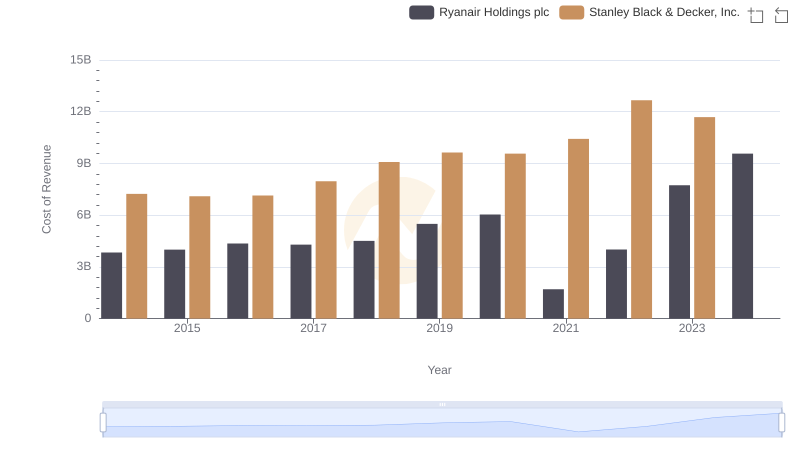
Cost of Revenue Comparison: Ryanair Holdings plc vs Stanley Black & Decker, Inc.
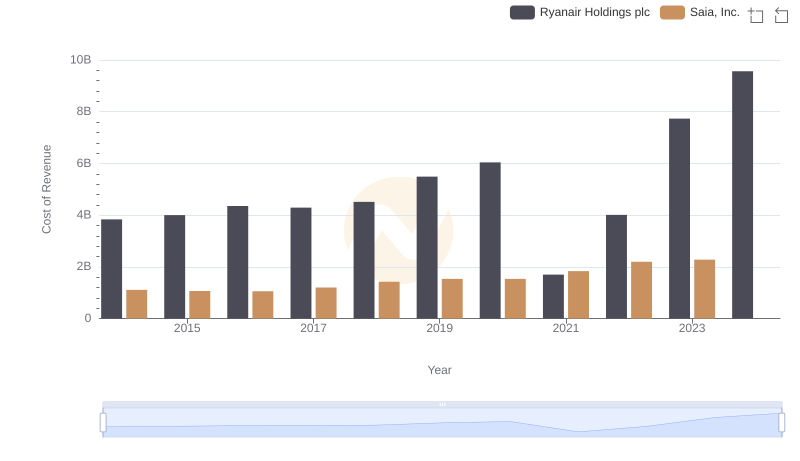
Cost of Revenue: Key Insights for Ryanair Holdings plc and Saia, Inc.
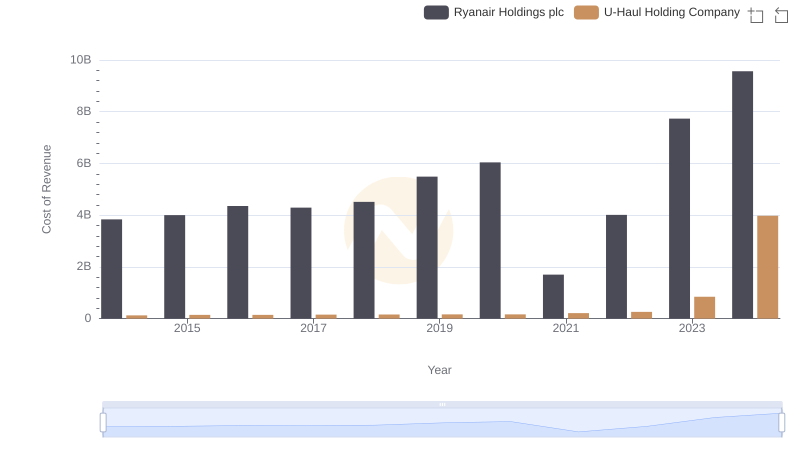
Ryanair Holdings plc vs U-Haul Holding Company: Efficiency in Cost of Revenue Explored
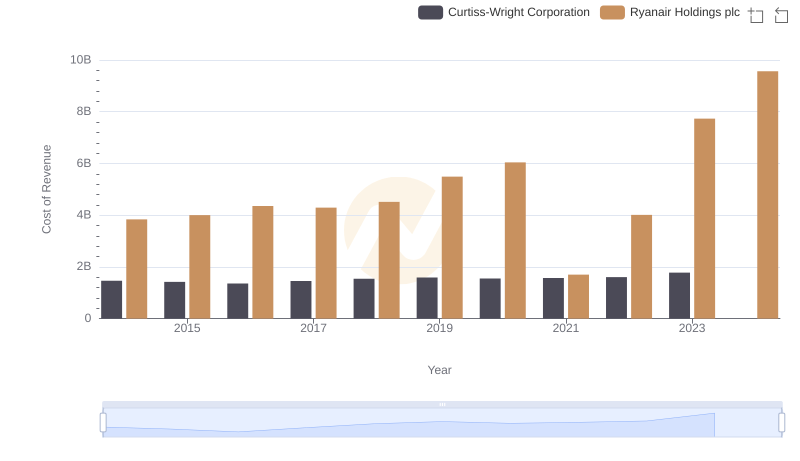
Cost of Revenue Trends: Ryanair Holdings plc vs Curtiss-Wright Corporation
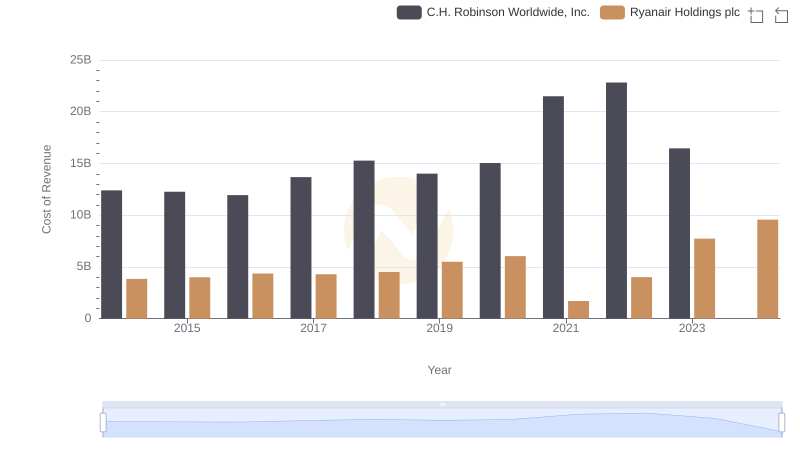
Cost Insights: Breaking Down Ryanair Holdings plc and C.H. Robinson Worldwide, Inc.'s Expenses
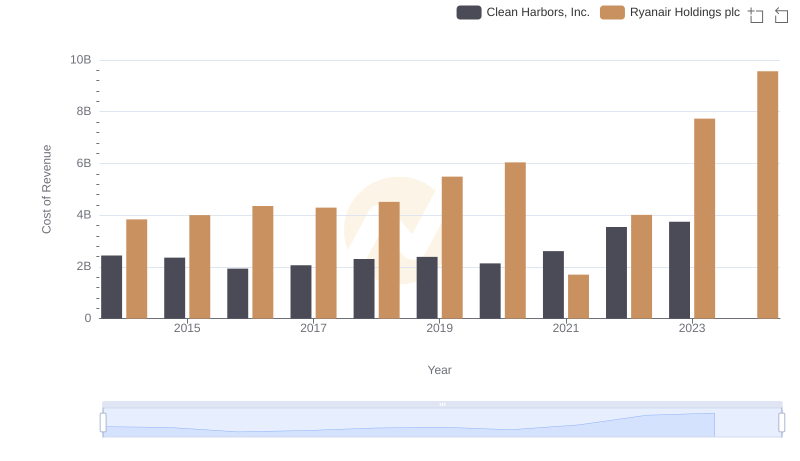
Cost of Revenue Trends: Ryanair Holdings plc vs Clean Harbors, Inc.
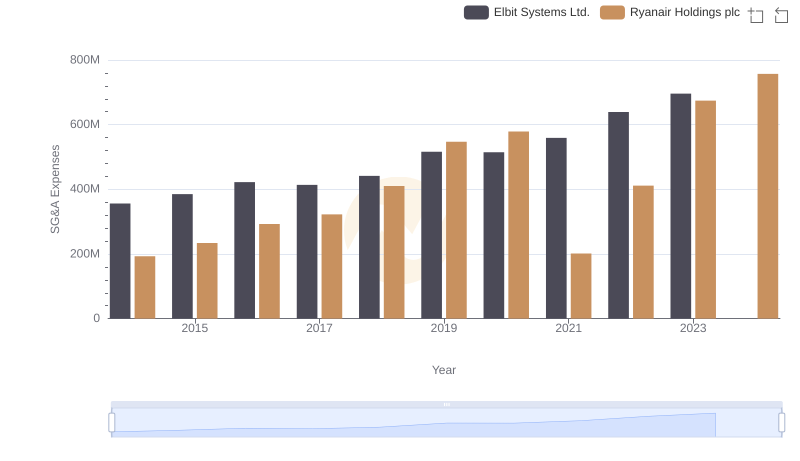
Selling, General, and Administrative Costs: Ryanair Holdings plc vs Elbit Systems Ltd.