| __timestamp | Comfort Systems USA, Inc. | Ryanair Holdings plc |
|---|---|---|
| Wednesday, January 1, 2014 | 1161024000 | 3838100000 |
| Thursday, January 1, 2015 | 1262390000 | 3999600000 |
| Friday, January 1, 2016 | 1290331000 | 4355900000 |
| Sunday, January 1, 2017 | 1421641000 | 4294000000 |
| Monday, January 1, 2018 | 1736600000 | 4512300000 |
| Tuesday, January 1, 2019 | 2113334000 | 5492800000 |
| Wednesday, January 1, 2020 | 2309676000 | 6039900000 |
| Friday, January 1, 2021 | 2510429000 | 1702700000 |
| Saturday, January 1, 2022 | 3398756000 | 4009800000 |
| Sunday, January 1, 2023 | 4216251000 | 7735000000 |
| Monday, January 1, 2024 | 9566400000 |
Igniting the spark of knowledge
In the ever-evolving landscape of global business, understanding cost dynamics is crucial. This chart offers a fascinating glimpse into the cost of revenue trends for Ryanair Holdings plc and Comfort Systems USA, Inc. over the past decade. From 2014 to 2023, Ryanair's cost of revenue soared by approximately 102%, peaking in 2023. This reflects the airline's aggressive expansion and operational adjustments. In contrast, Comfort Systems USA, Inc. experienced a more gradual increase of around 263% during the same period, highlighting its steady growth in the construction services sector.
The year 2021 marked a significant dip for Ryanair, with costs plummeting to their lowest, likely due to the pandemic's impact on air travel. Meanwhile, Comfort Systems USA, Inc. maintained a consistent upward trajectory, underscoring its resilience. As we look to the future, these trends offer valuable insights into the strategic maneuvers of these industry giants.
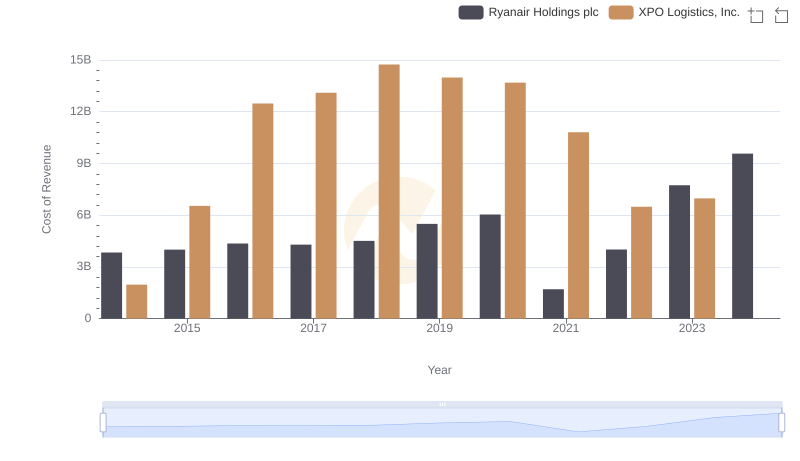
Cost of Revenue: Key Insights for Ryanair Holdings plc and XPO Logistics, Inc.
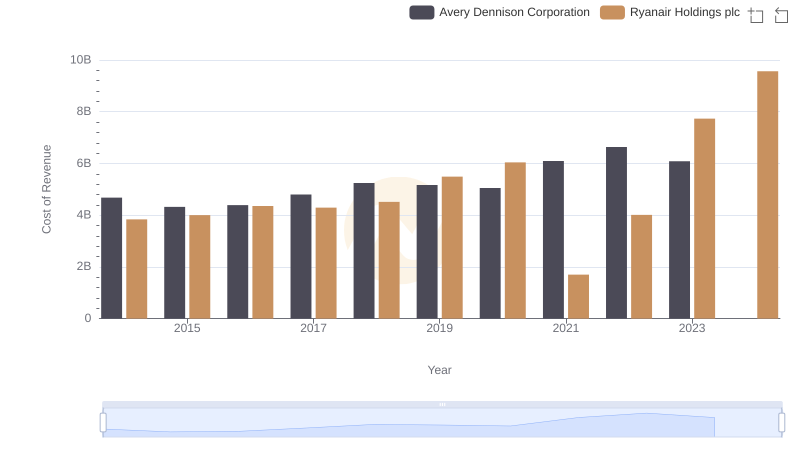
Ryanair Holdings plc vs Avery Dennison Corporation: Efficiency in Cost of Revenue Explored
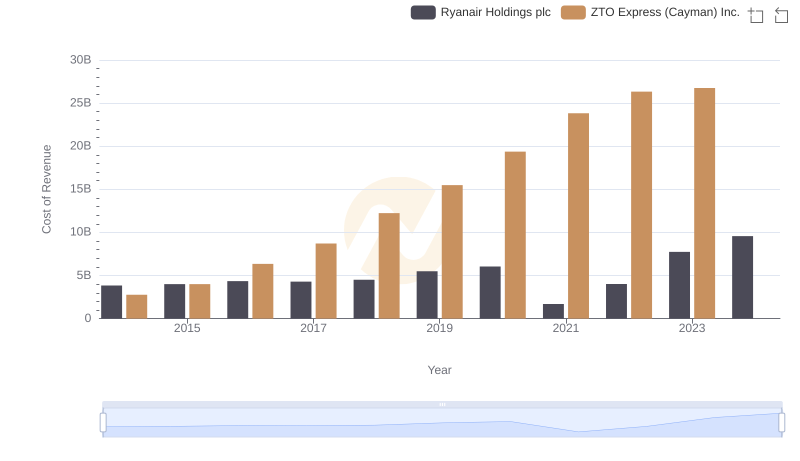
Cost Insights: Breaking Down Ryanair Holdings plc and ZTO Express (Cayman) Inc.'s Expenses
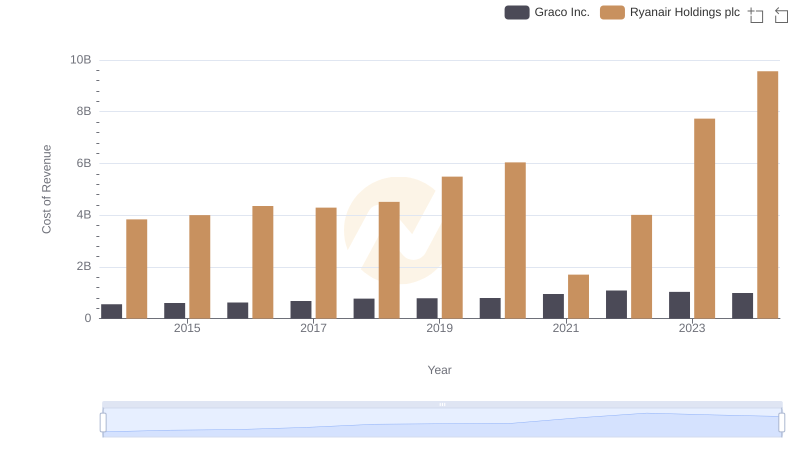
Ryanair Holdings plc vs Graco Inc.: Efficiency in Cost of Revenue Explored
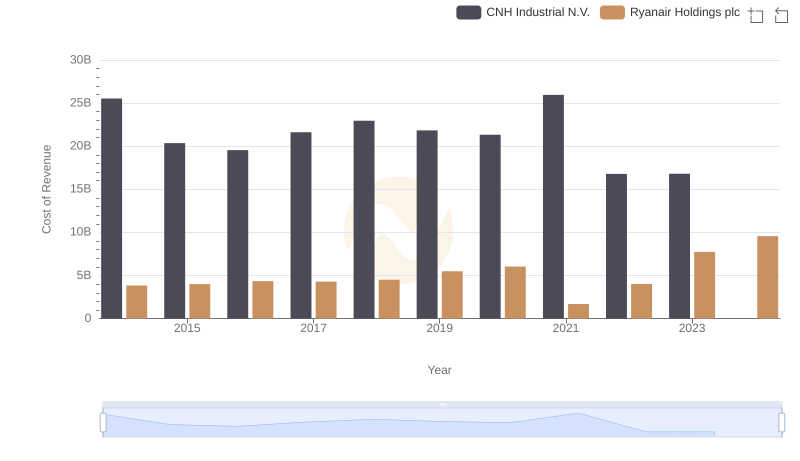
Analyzing Cost of Revenue: Ryanair Holdings plc and CNH Industrial N.V.
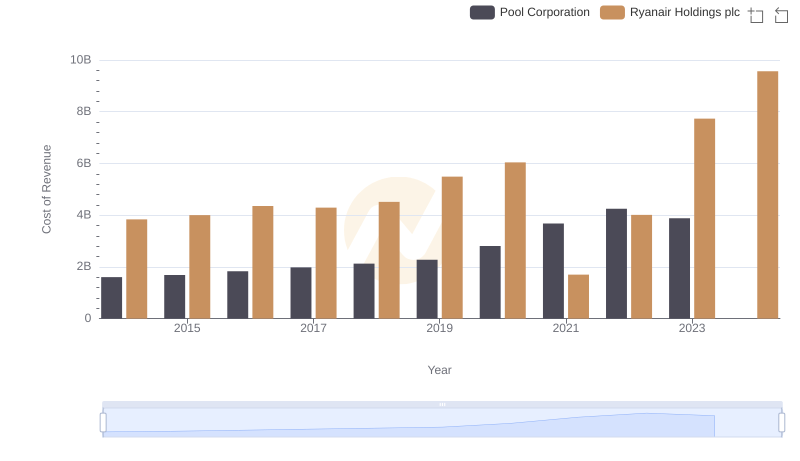
Cost Insights: Breaking Down Ryanair Holdings plc and Pool Corporation's Expenses
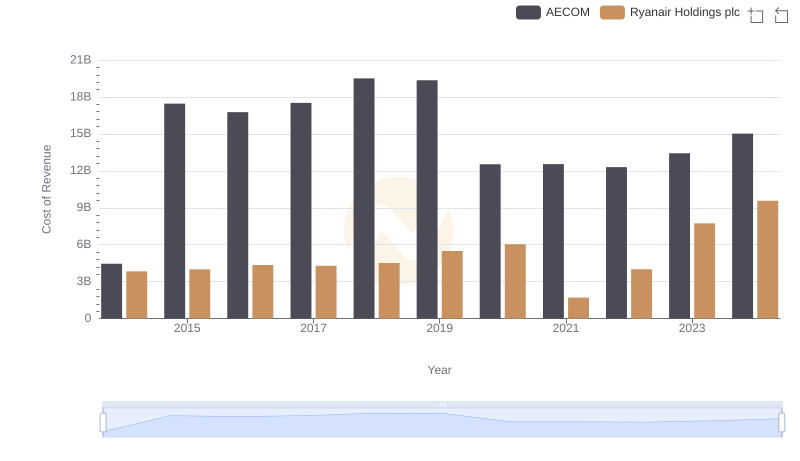
Cost Insights: Breaking Down Ryanair Holdings plc and AECOM's Expenses
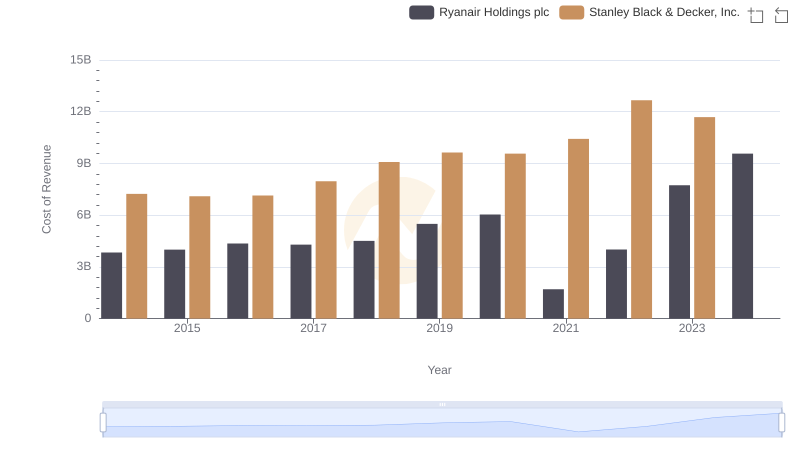
Cost of Revenue Comparison: Ryanair Holdings plc vs Stanley Black & Decker, Inc.
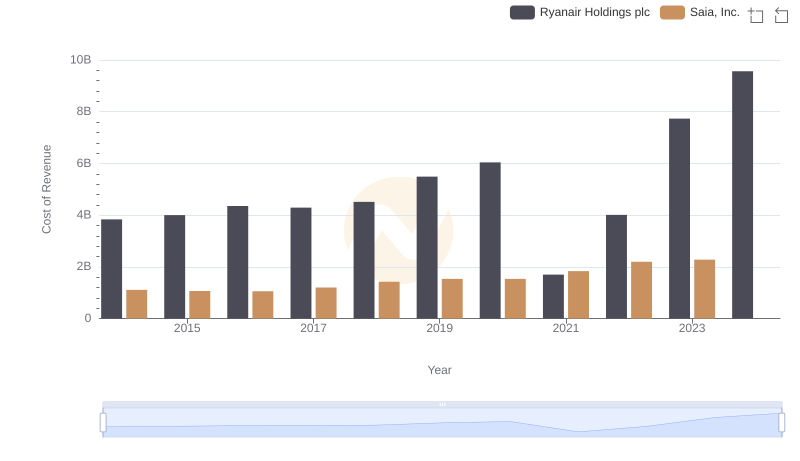
Cost of Revenue: Key Insights for Ryanair Holdings plc and Saia, Inc.
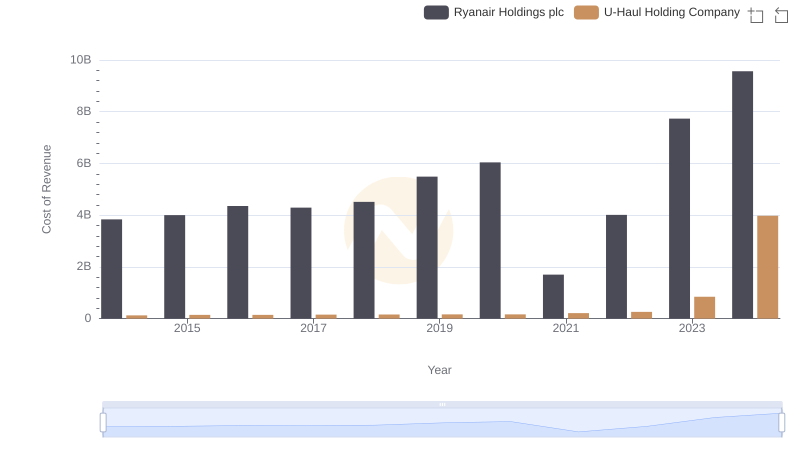
Ryanair Holdings plc vs U-Haul Holding Company: Efficiency in Cost of Revenue Explored
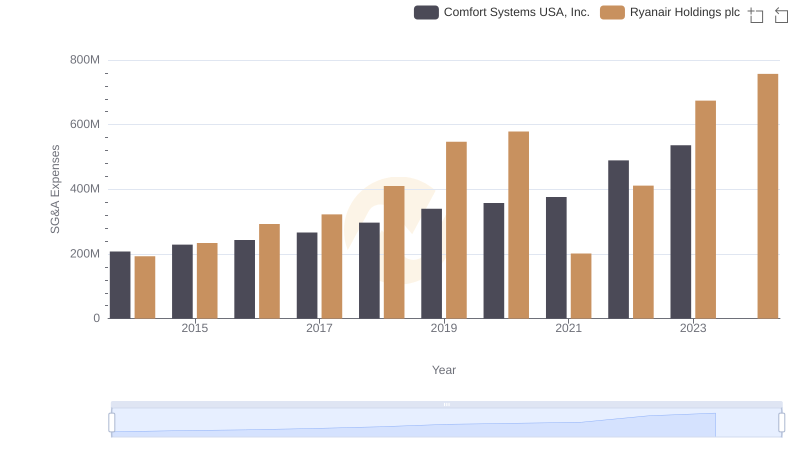
SG&A Efficiency Analysis: Comparing Ryanair Holdings plc and Comfort Systems USA, Inc.