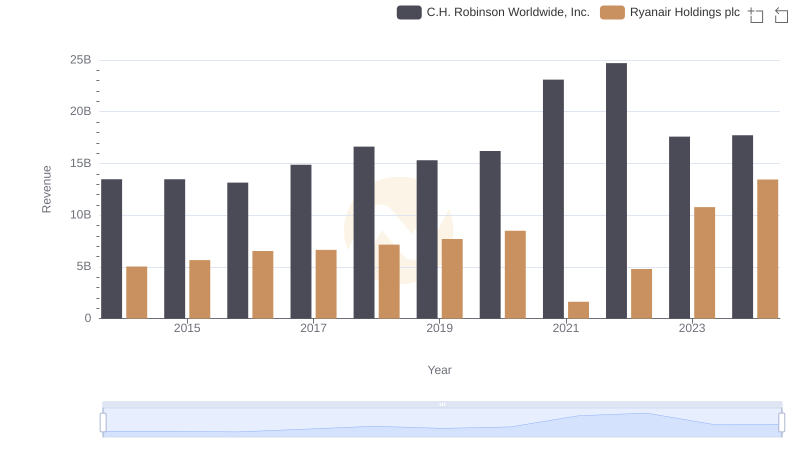
| __timestamp | C.H. Robinson Worldwide, Inc. | Ryanair Holdings plc |
|---|---|---|
| Wednesday, January 1, 2014 | 12401436000 | 3838100000 |
| Thursday, January 1, 2015 | 12259014000 | 3999600000 |
| Friday, January 1, 2016 | 11931821000 | 4355900000 |
| Sunday, January 1, 2017 | 13680857000 | 4294000000 |
| Monday, January 1, 2018 | 15269479000 | 4512300000 |
| Tuesday, January 1, 2019 | 14021726000 | 5492800000 |
| Wednesday, January 1, 2020 | 15037716000 | 6039900000 |
| Friday, January 1, 2021 | 21493659000 | 1702700000 |
| Saturday, January 1, 2022 | 22826428000 | 4009800000 |
| Sunday, January 1, 2023 | 16457570000 | 7735000000 |
| Monday, January 1, 2024 | 16416191000 | 9566400000 |
Unleashing insights
In the ever-evolving landscape of global business, understanding cost structures is crucial for strategic decision-making. This analysis delves into the cost of revenue trends for Ryanair Holdings plc and C.H. Robinson Worldwide, Inc. over the past decade. From 2014 to 2023, C.H. Robinson's cost of revenue fluctuated significantly, peaking in 2022 with a 64% increase from its 2014 figures. Meanwhile, Ryanair's cost of revenue showed a steady upward trajectory, culminating in a 150% rise by 2023 compared to 2014.
The data reveals a stark contrast in cost management strategies between the two companies. While C.H. Robinson experienced a dramatic spike in 2021, Ryanair's costs dipped in the same year, reflecting the airline industry's pandemic-induced challenges. As we look to 2024, Ryanair's costs continue to climb, whereas C.H. Robinson's data is notably absent, indicating potential reporting delays or strategic shifts.
Ryanair Holdings plc vs C.H. Robinson Worldwide, Inc.: Examining Key Revenue Metrics
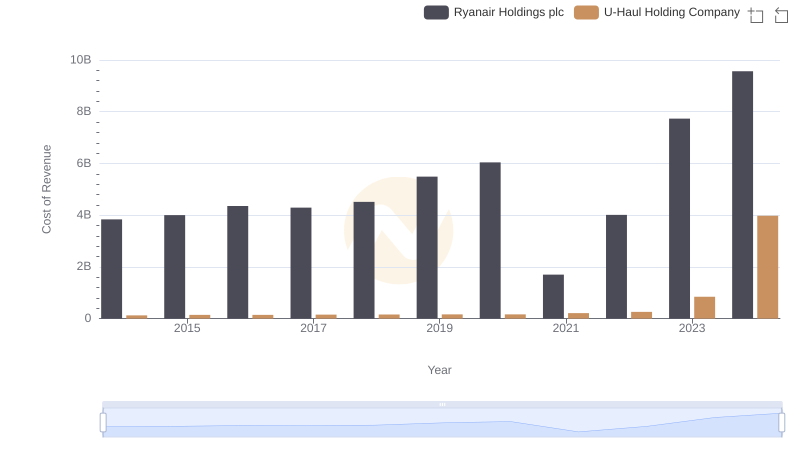
Ryanair Holdings plc vs U-Haul Holding Company: Efficiency in Cost of Revenue Explored
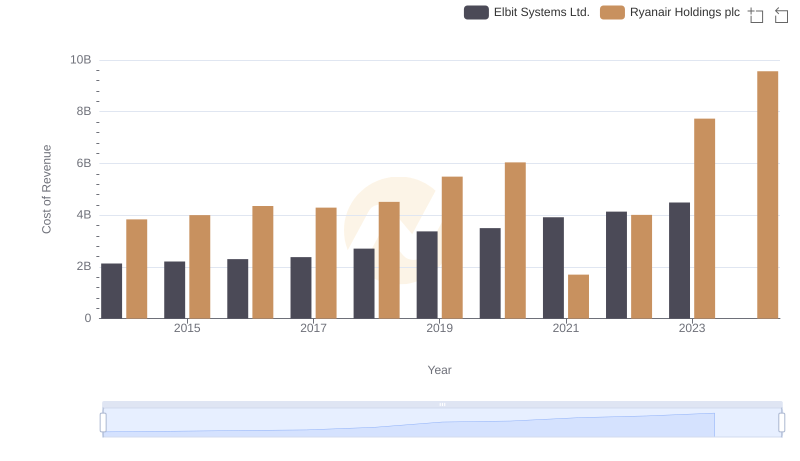
Analyzing Cost of Revenue: Ryanair Holdings plc and Elbit Systems Ltd.
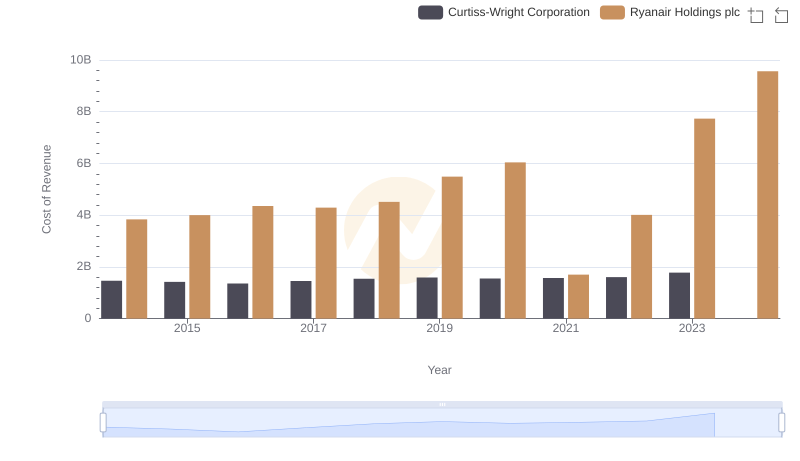
Cost of Revenue Trends: Ryanair Holdings plc vs Curtiss-Wright Corporation
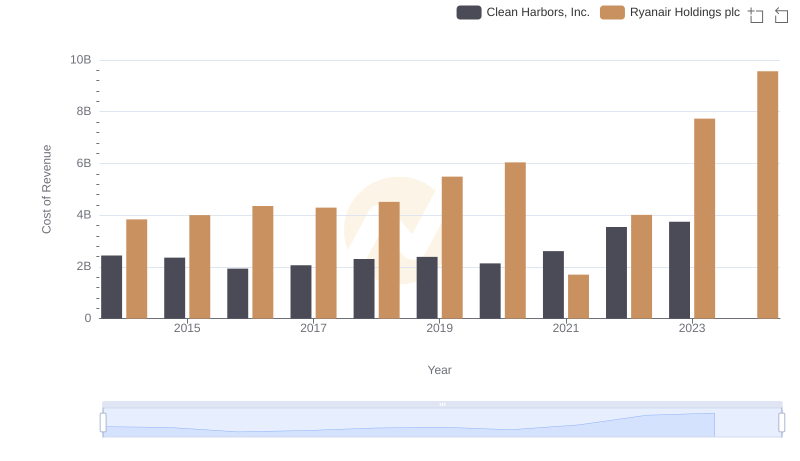
Cost of Revenue Trends: Ryanair Holdings plc vs Clean Harbors, Inc.
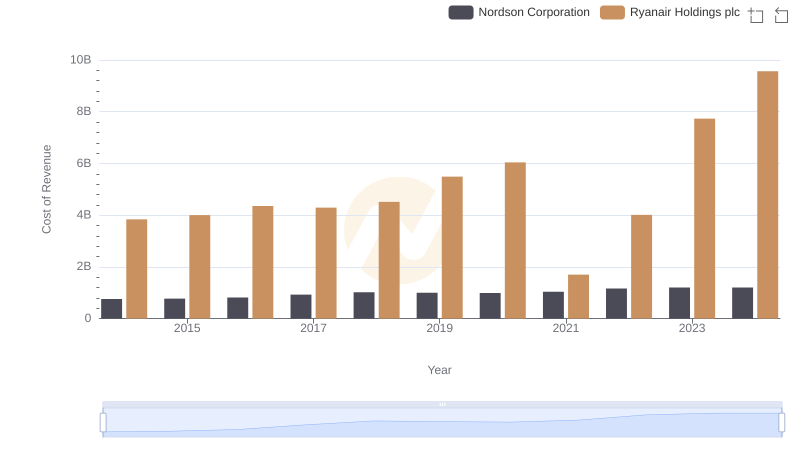
Cost Insights: Breaking Down Ryanair Holdings plc and Nordson Corporation's Expenses
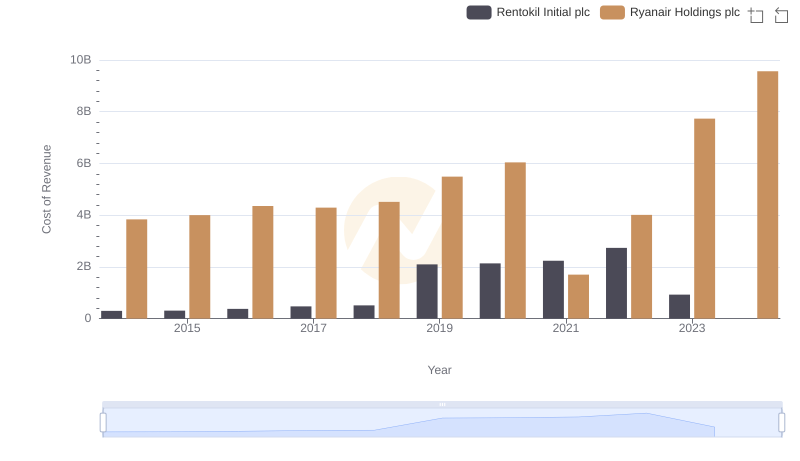
Cost of Revenue: Key Insights for Ryanair Holdings plc and Rentokil Initial plc
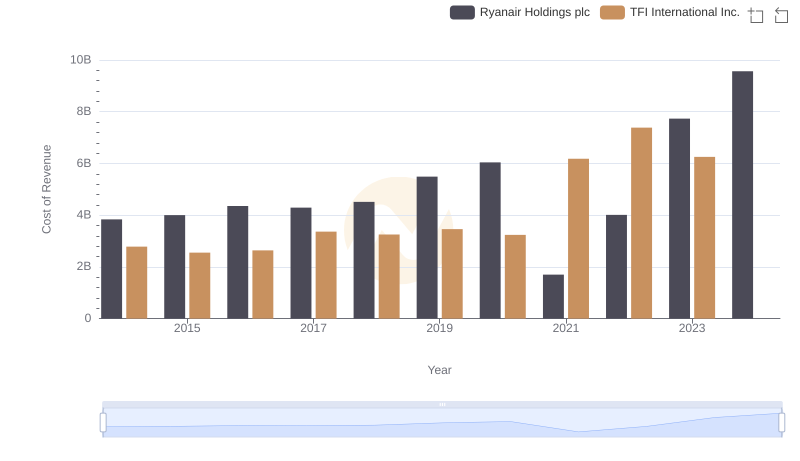
Cost Insights: Breaking Down Ryanair Holdings plc and TFI International Inc.'s Expenses
Cost Insights: Breaking Down Ryanair Holdings plc and Allegion plc's Expenses
Analyzing Cost of Revenue: Ryanair Holdings plc and ITT Inc.
Cost of Revenue Comparison: Ryanair Holdings plc vs American Airlines Group Inc.
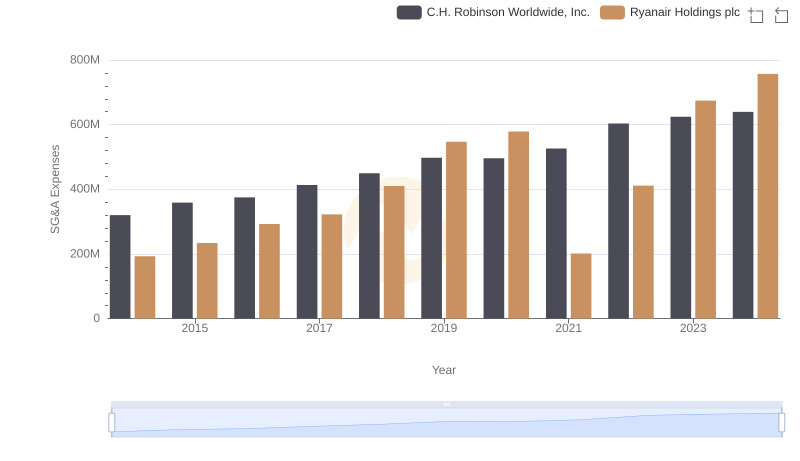
Ryanair Holdings plc vs C.H. Robinson Worldwide, Inc.: SG&A Expense Trends