| __timestamp | AECOM | Ryanair Holdings plc |
|---|---|---|
| Wednesday, January 1, 2014 | 4452451000 | 3838100000 |
| Thursday, January 1, 2015 | 17454692000 | 3999600000 |
| Friday, January 1, 2016 | 16768001000 | 4355900000 |
| Sunday, January 1, 2017 | 17519682000 | 4294000000 |
| Monday, January 1, 2018 | 19504863000 | 4512300000 |
| Tuesday, January 1, 2019 | 19359884000 | 5492800000 |
| Wednesday, January 1, 2020 | 12530416000 | 6039900000 |
| Friday, January 1, 2021 | 12542431000 | 1702700000 |
| Saturday, January 1, 2022 | 12300208000 | 4009800000 |
| Sunday, January 1, 2023 | 13432996000 | 7735000000 |
| Monday, January 1, 2024 | 15021157000 | 9566400000 |
Igniting the spark of knowledge
In the ever-evolving landscape of global business, understanding cost structures is pivotal. This analysis delves into the cost of revenue trends for Ryanair Holdings plc and AECOM from 2014 to 2024. AECOM, a leader in infrastructure, consistently outpaces Ryanair in cost of revenue, with a peak in 2018 reaching nearly 20 billion USD. In contrast, Ryanair, a titan in the aviation industry, shows a more volatile pattern, with costs peaking in 2024 at approximately 9.6 billion USD, a staggering 150% increase from 2014. The data reveals a significant dip for both companies in 2021, likely reflecting the global economic impact of the COVID-19 pandemic. As we look towards 2024, AECOM's costs stabilize, while Ryanair's expenses soar, highlighting the dynamic nature of the aviation sector. This comparative insight underscores the importance of strategic cost management in maintaining competitive advantage.
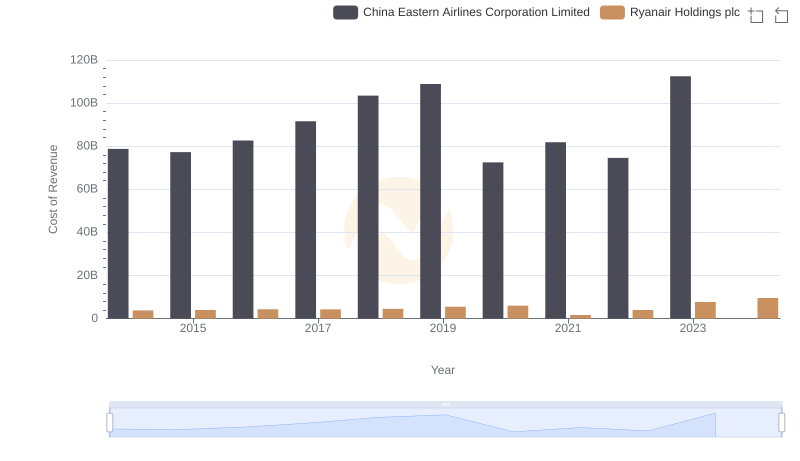
Ryanair Holdings plc vs China Eastern Airlines Corporation Limited: Efficiency in Cost of Revenue Explored
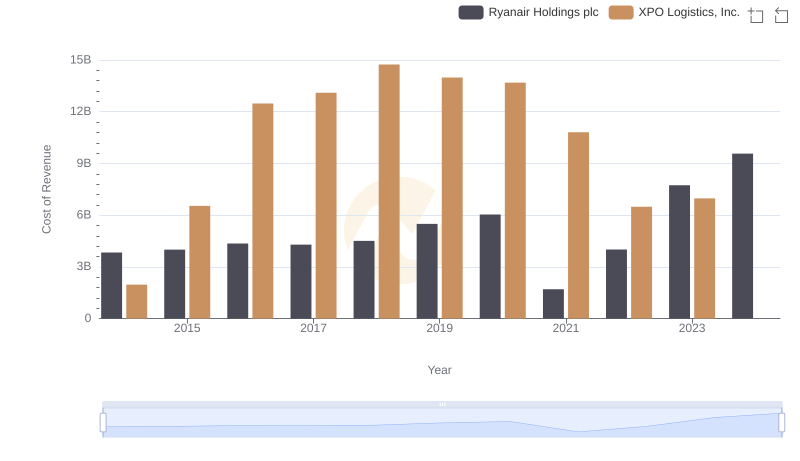
Cost of Revenue: Key Insights for Ryanair Holdings plc and XPO Logistics, Inc.
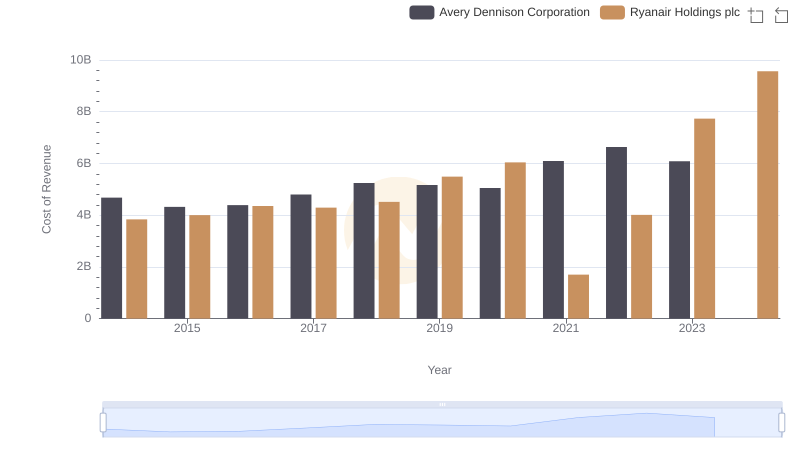
Ryanair Holdings plc vs Avery Dennison Corporation: Efficiency in Cost of Revenue Explored
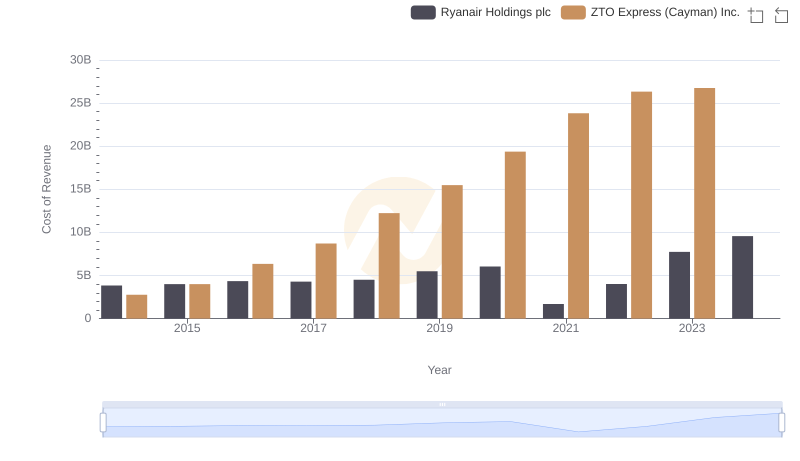
Cost Insights: Breaking Down Ryanair Holdings plc and ZTO Express (Cayman) Inc.'s Expenses
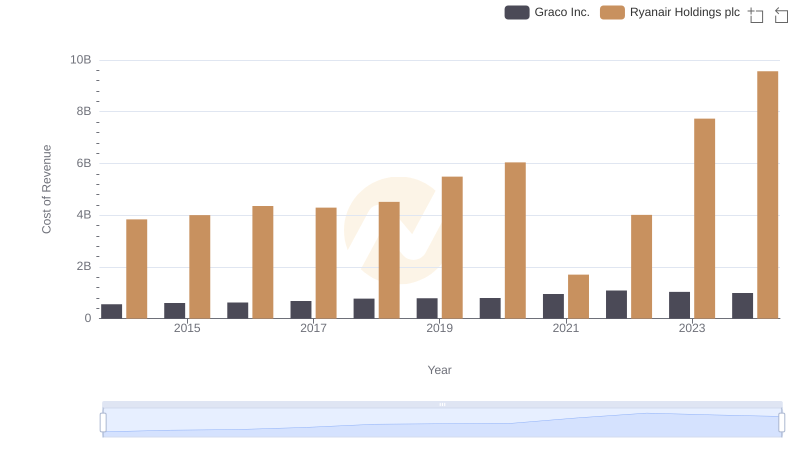
Ryanair Holdings plc vs Graco Inc.: Efficiency in Cost of Revenue Explored
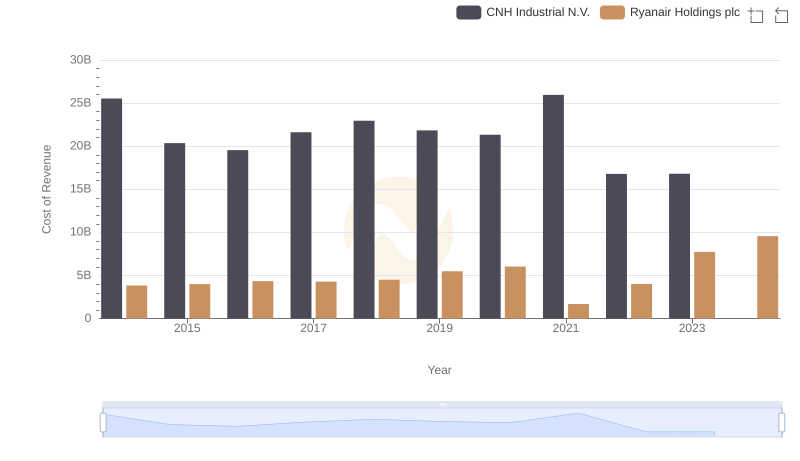
Analyzing Cost of Revenue: Ryanair Holdings plc and CNH Industrial N.V.
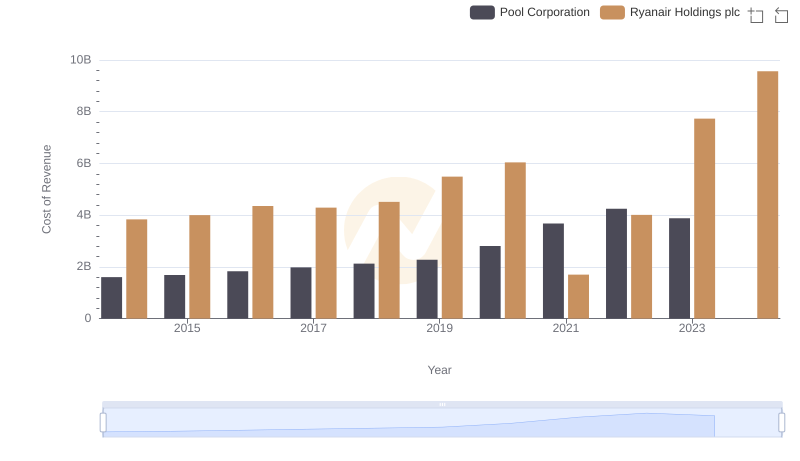
Cost Insights: Breaking Down Ryanair Holdings plc and Pool Corporation's Expenses
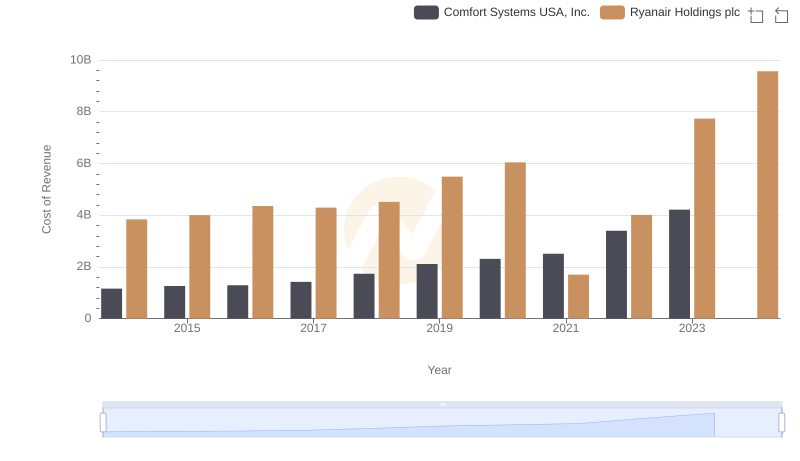
Cost of Revenue Trends: Ryanair Holdings plc vs Comfort Systems USA, Inc.
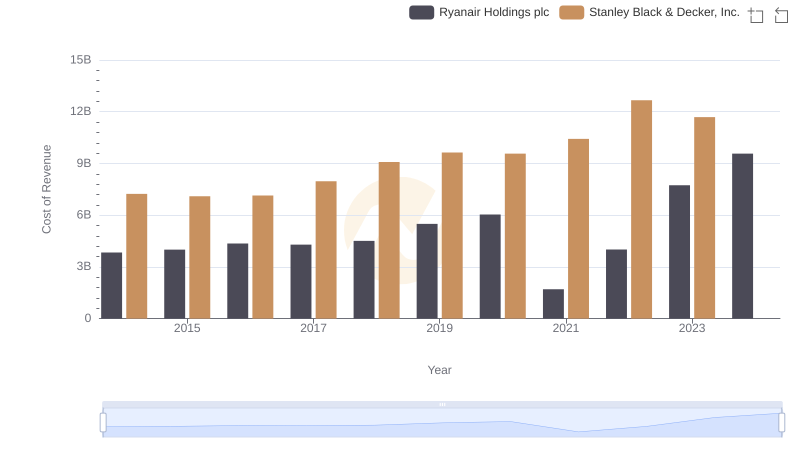
Cost of Revenue Comparison: Ryanair Holdings plc vs Stanley Black & Decker, Inc.
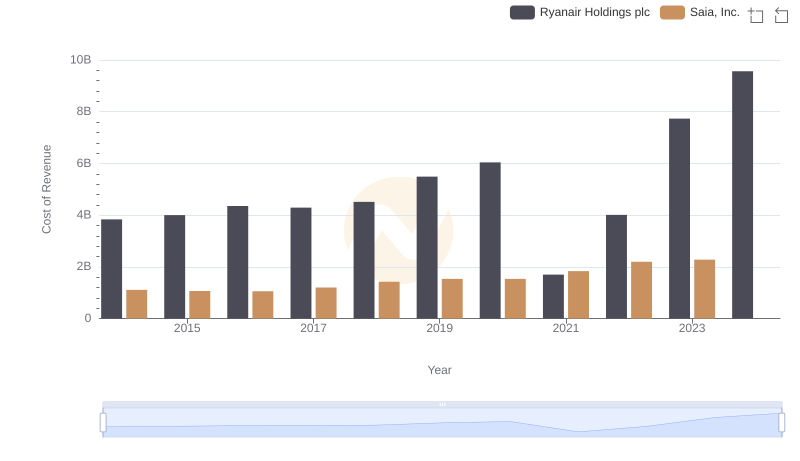
Cost of Revenue: Key Insights for Ryanair Holdings plc and Saia, Inc.

Who Optimizes SG&A Costs Better? Ryanair Holdings plc or AECOM