| __timestamp | Expeditors International of Washington, Inc. | Rockwell Automation, Inc. |
|---|---|---|
| Wednesday, January 1, 2014 | 5800725000 | 3869600000 |
| Thursday, January 1, 2015 | 5720848000 | 3604800000 |
| Friday, January 1, 2016 | 5247244000 | 3404000000 |
| Sunday, January 1, 2017 | 6037921000 | 3687100000 |
| Monday, January 1, 2018 | 7118083000 | 3793800000 |
| Tuesday, January 1, 2019 | 7178405000 | 3794700000 |
| Wednesday, January 1, 2020 | 8953716000 | 3734600000 |
| Friday, January 1, 2021 | 14358105000 | 4099700000 |
| Saturday, January 1, 2022 | 14900154000 | 4658400000 |
| Sunday, January 1, 2023 | 8054634000 | 5341000000 |
| Monday, January 1, 2024 | 0 | 5070800000 |
In pursuit of knowledge
In the ever-evolving landscape of industrial automation and logistics, Rockwell Automation, Inc. and Expeditors International of Washington, Inc. stand as titans. Over the past decade, these companies have navigated the complexities of cost management with varying strategies. From 2014 to 2023, Expeditors International saw a remarkable 157% increase in its cost of revenue, peaking in 2022. This surge reflects the company's aggressive expansion and adaptation to global supply chain challenges. In contrast, Rockwell Automation's cost of revenue grew by approximately 38% over the same period, indicating a more measured approach to scaling operations. Notably, 2023 marked a divergence, with Expeditors experiencing a significant drop, while Rockwell Automation continued its steady climb. This data underscores the dynamic nature of these industries and the strategic decisions that shape their financial landscapes. As we look to the future, the missing data for 2024 invites speculation on how these trends will evolve.
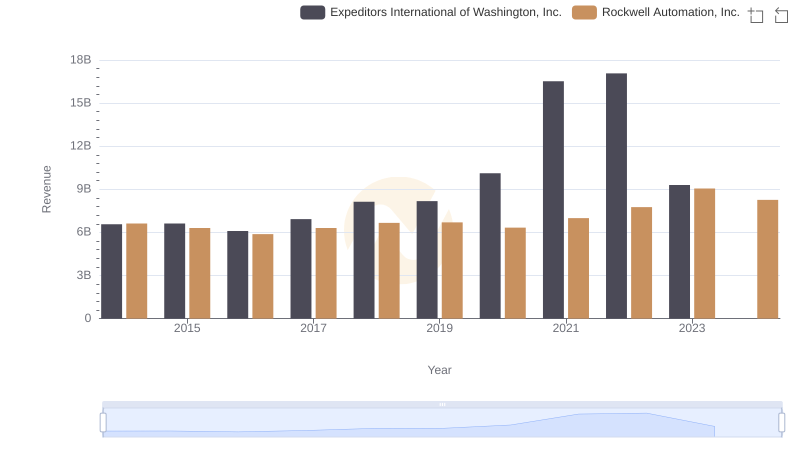
Comparing Revenue Performance: Rockwell Automation, Inc. or Expeditors International of Washington, Inc.?
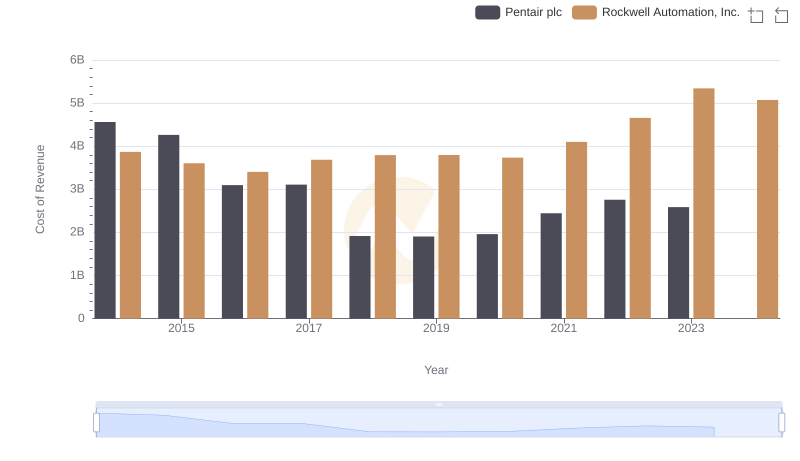
Cost of Revenue Trends: Rockwell Automation, Inc. vs Pentair plc
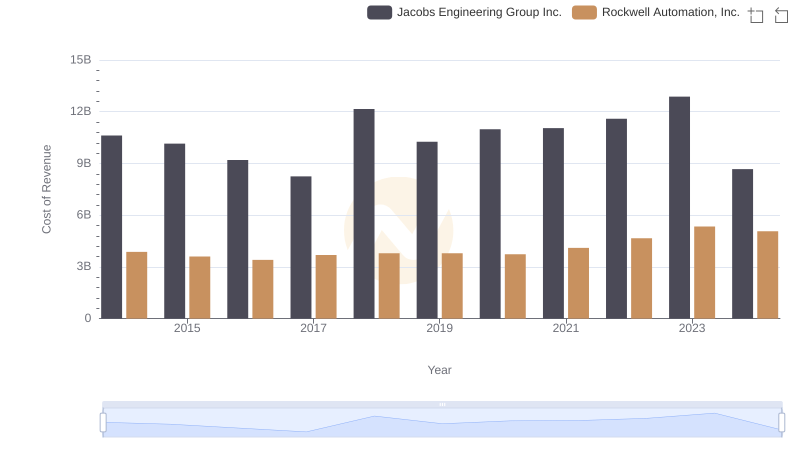
Cost of Revenue: Key Insights for Rockwell Automation, Inc. and Jacobs Engineering Group Inc.
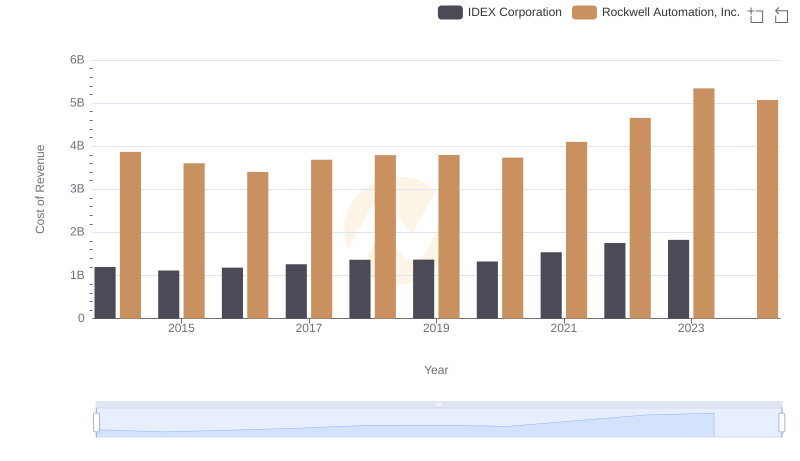
Cost Insights: Breaking Down Rockwell Automation, Inc. and IDEX Corporation's Expenses
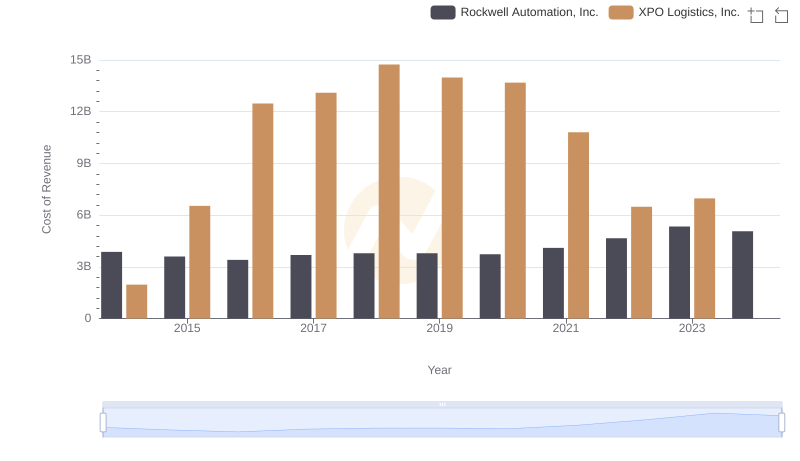
Cost of Revenue: Key Insights for Rockwell Automation, Inc. and XPO Logistics, Inc.
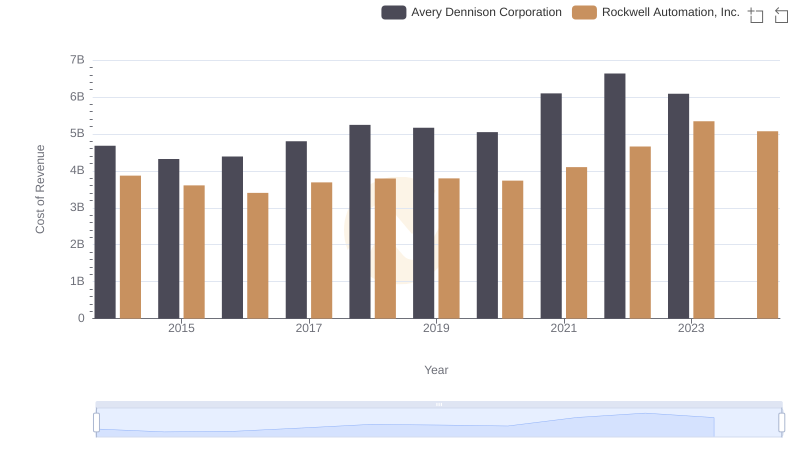
Analyzing Cost of Revenue: Rockwell Automation, Inc. and Avery Dennison Corporation
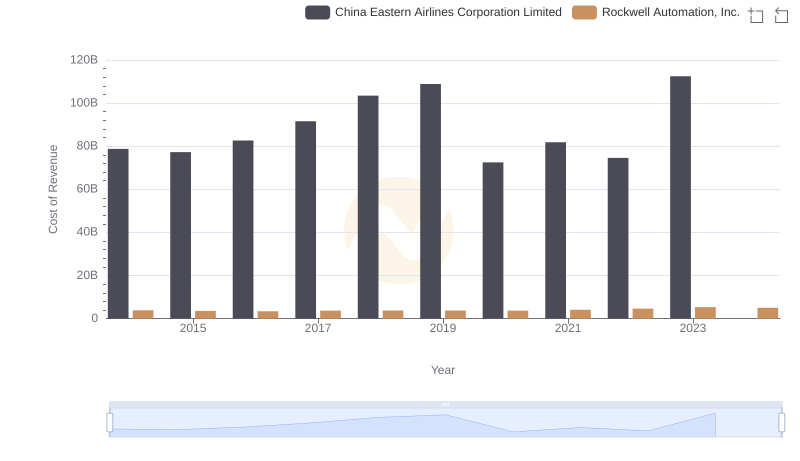
Cost of Revenue: Key Insights for Rockwell Automation, Inc. and China Eastern Airlines Corporation Limited

Gross Profit Comparison: Rockwell Automation, Inc. and Expeditors International of Washington, Inc. Trends

Cost Management Insights: SG&A Expenses for Rockwell Automation, Inc. and Expeditors International of Washington, Inc.

A Professional Review of EBITDA: Rockwell Automation, Inc. Compared to Expeditors International of Washington, Inc.