| __timestamp | China Eastern Airlines Corporation Limited | Rockwell Automation, Inc. |
|---|---|---|
| Wednesday, January 1, 2014 | 78741000000 | 3869600000 |
| Thursday, January 1, 2015 | 77237000000 | 3604800000 |
| Friday, January 1, 2016 | 82676000000 | 3404000000 |
| Sunday, January 1, 2017 | 91592000000 | 3687100000 |
| Monday, January 1, 2018 | 103476000000 | 3793800000 |
| Tuesday, January 1, 2019 | 108865000000 | 3794700000 |
| Wednesday, January 1, 2020 | 72523000000 | 3734600000 |
| Friday, January 1, 2021 | 81828000000 | 4099700000 |
| Saturday, January 1, 2022 | 74599000000 | 4658400000 |
| Sunday, January 1, 2023 | 112461000000 | 5341000000 |
| Monday, January 1, 2024 | 5070800000 |
In pursuit of knowledge
In the ever-evolving landscape of global industries, understanding the cost of revenue is crucial for evaluating a company's financial health. This analysis delves into the cost of revenue trends for Rockwell Automation, Inc. and China Eastern Airlines Corporation Limited from 2014 to 2023.
Rockwell Automation, a leader in industrial automation, has shown a steady increase in its cost of revenue, peaking at approximately $5.34 billion in 2023. This represents a 38% increase from 2014, reflecting the company's expansion and increased operational costs.
China Eastern Airlines, a major player in the aviation industry, experienced fluctuations in its cost of revenue. Notably, 2023 saw a significant rise to $112 billion, marking a 43% increase from 2014. This surge highlights the airline's recovery and growth post-pandemic.
While both companies have faced challenges, their cost of revenue trends underscore their resilience and strategic growth in their respective sectors.
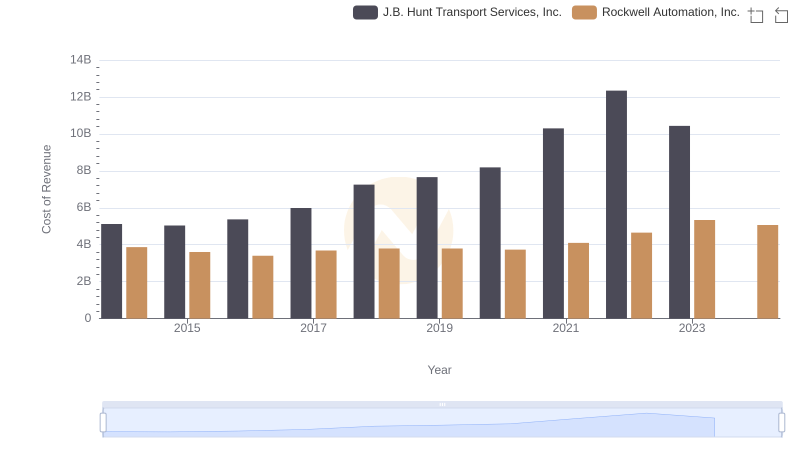
Analyzing Cost of Revenue: Rockwell Automation, Inc. and J.B. Hunt Transport Services, Inc.
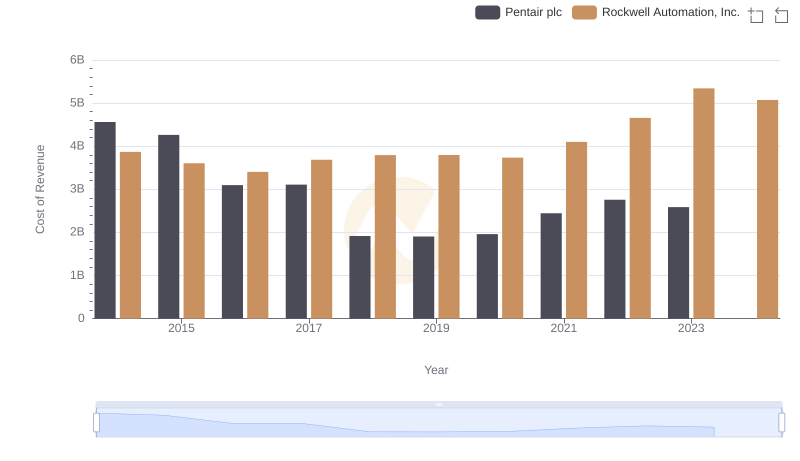
Cost of Revenue Trends: Rockwell Automation, Inc. vs Pentair plc
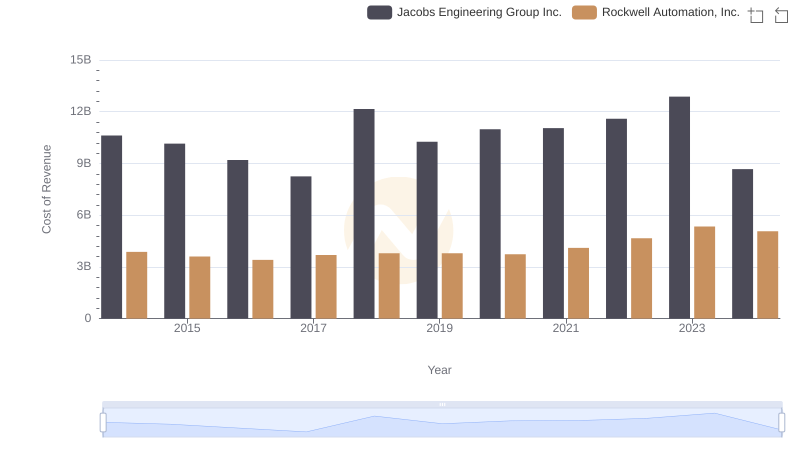
Cost of Revenue: Key Insights for Rockwell Automation, Inc. and Jacobs Engineering Group Inc.
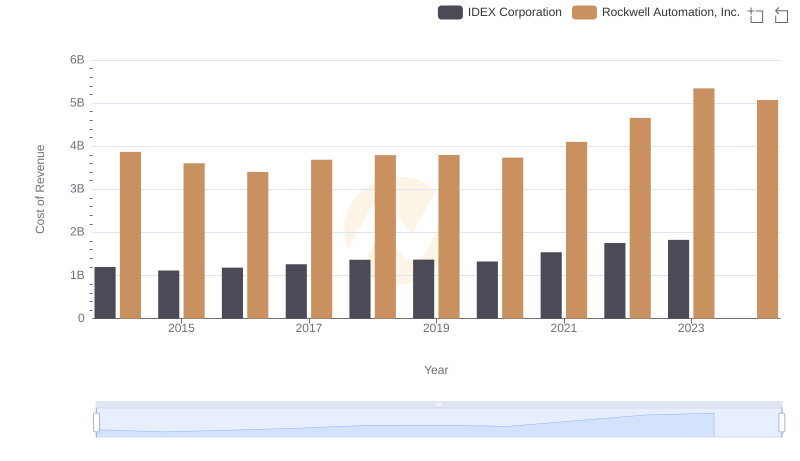
Cost Insights: Breaking Down Rockwell Automation, Inc. and IDEX Corporation's Expenses
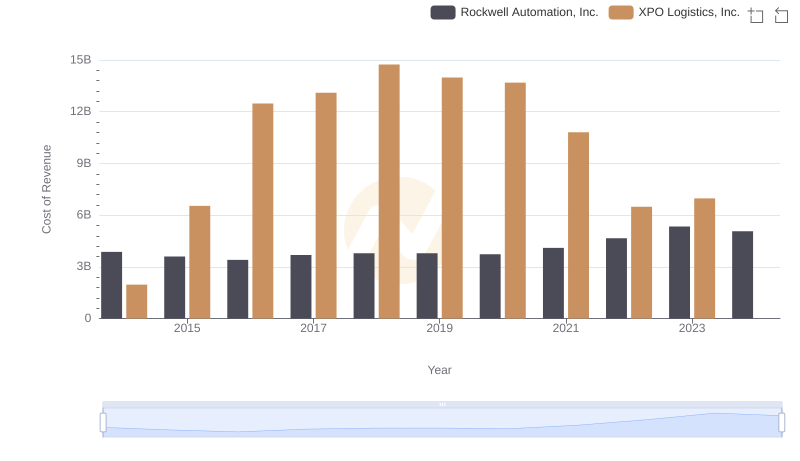
Cost of Revenue: Key Insights for Rockwell Automation, Inc. and XPO Logistics, Inc.
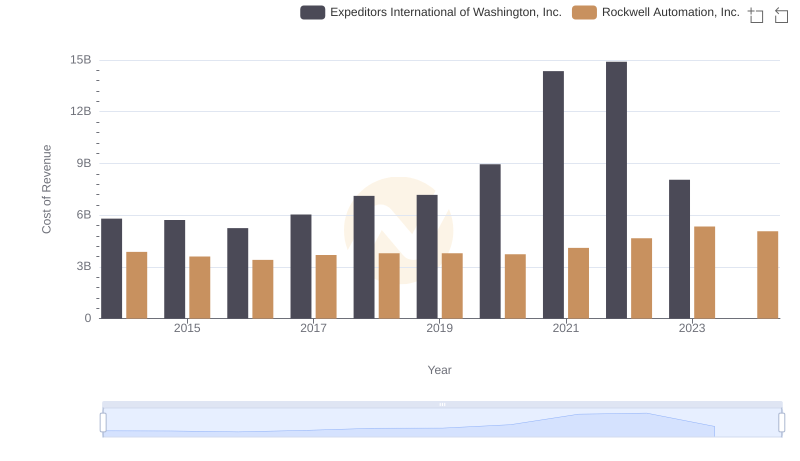
Analyzing Cost of Revenue: Rockwell Automation, Inc. and Expeditors International of Washington, Inc.
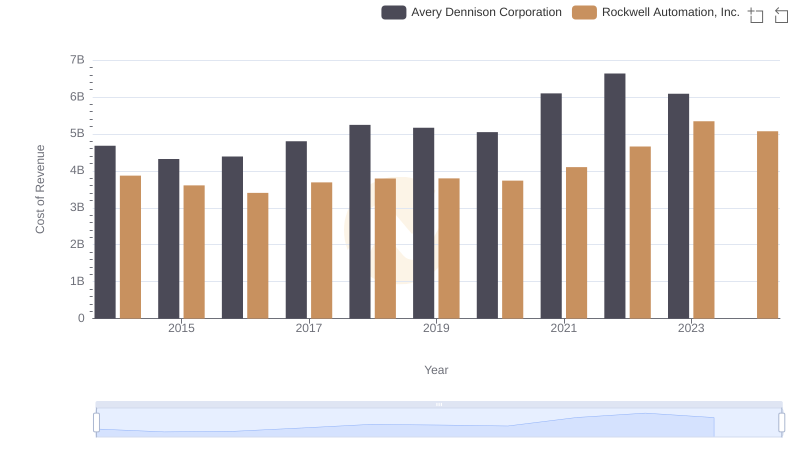
Analyzing Cost of Revenue: Rockwell Automation, Inc. and Avery Dennison Corporation
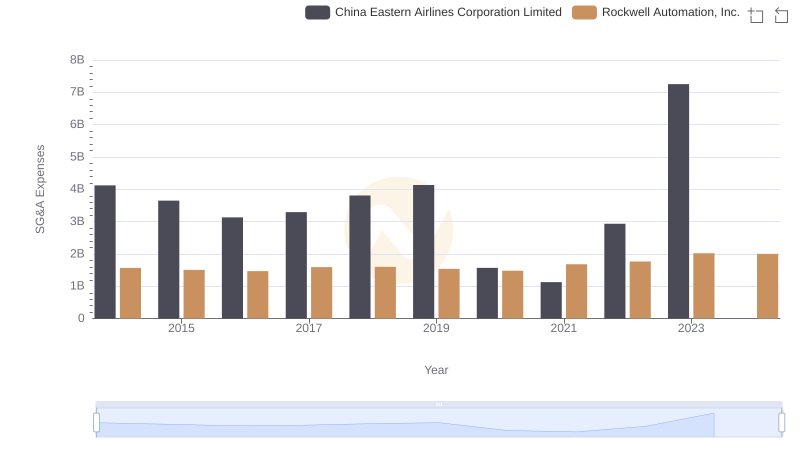
Breaking Down SG&A Expenses: Rockwell Automation, Inc. vs China Eastern Airlines Corporation Limited

Rockwell Automation, Inc. vs ZTO Express (Cayman) Inc.: Efficiency in Cost of Revenue Explored