| __timestamp | Rockwell Automation, Inc. | XPO Logistics, Inc. |
|---|---|---|
| Wednesday, January 1, 2014 | 3869600000 | 1975000000 |
| Thursday, January 1, 2015 | 3604800000 | 6538400000 |
| Friday, January 1, 2016 | 3404000000 | 12480100000 |
| Sunday, January 1, 2017 | 3687100000 | 13101100000 |
| Monday, January 1, 2018 | 3793800000 | 14738000000 |
| Tuesday, January 1, 2019 | 3794700000 | 13982000000 |
| Wednesday, January 1, 2020 | 3734600000 | 13689000000 |
| Friday, January 1, 2021 | 4099700000 | 10812000000 |
| Saturday, January 1, 2022 | 4658400000 | 6491000000 |
| Sunday, January 1, 2023 | 5341000000 | 6974000000 |
| Monday, January 1, 2024 | 5070800000 | 7157000000 |
Unveiling the hidden dimensions of data
In the ever-evolving landscape of industrial automation and logistics, understanding cost dynamics is crucial. Rockwell Automation, Inc. and XPO Logistics, Inc. have shown distinct trends in their cost of revenue from 2014 to 2023. Rockwell Automation's cost of revenue has steadily increased by approximately 38%, peaking in 2023. This growth reflects their strategic investments in automation technologies. In contrast, XPO Logistics experienced a dramatic rise of over 600% from 2014 to 2018, followed by a decline, indicating potential shifts in operational strategies or market conditions. Notably, data for 2024 is missing for XPO, suggesting a need for further investigation. These insights highlight the importance of cost management in maintaining competitive advantage in their respective industries.
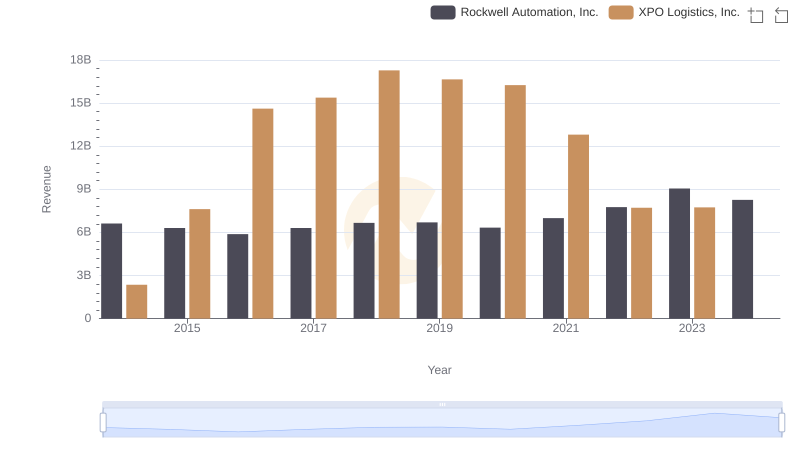
Revenue Showdown: Rockwell Automation, Inc. vs XPO Logistics, Inc.
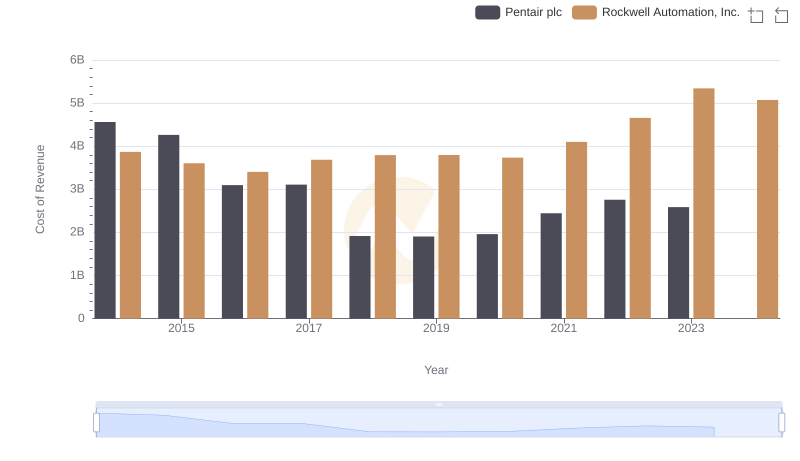
Cost of Revenue Trends: Rockwell Automation, Inc. vs Pentair plc
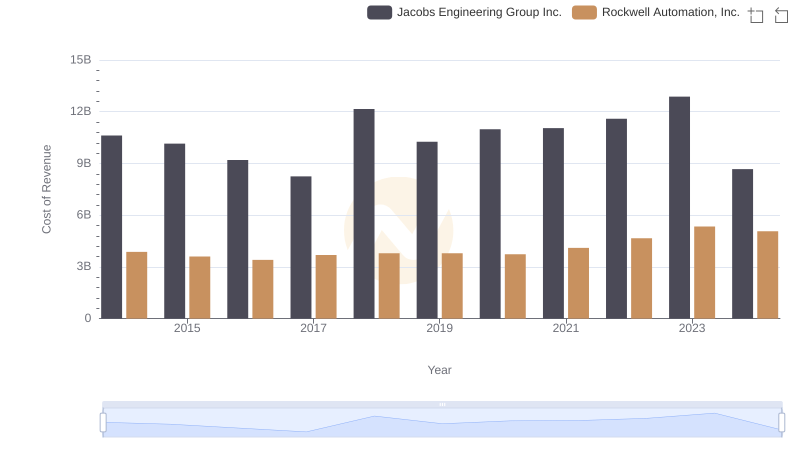
Cost of Revenue: Key Insights for Rockwell Automation, Inc. and Jacobs Engineering Group Inc.
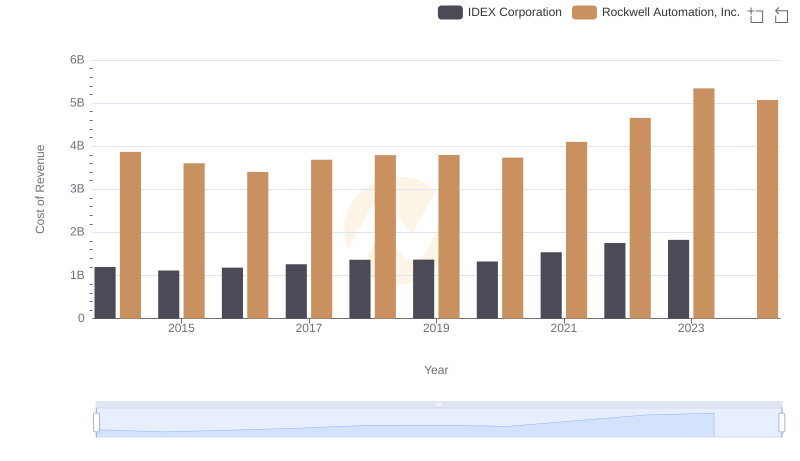
Cost Insights: Breaking Down Rockwell Automation, Inc. and IDEX Corporation's Expenses
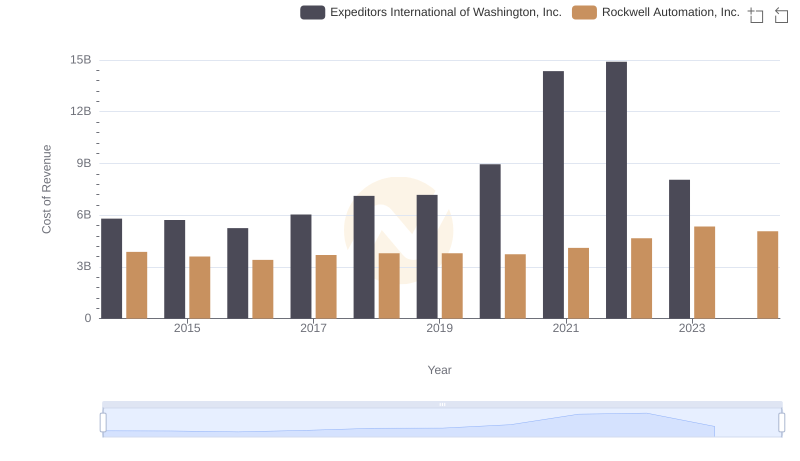
Analyzing Cost of Revenue: Rockwell Automation, Inc. and Expeditors International of Washington, Inc.
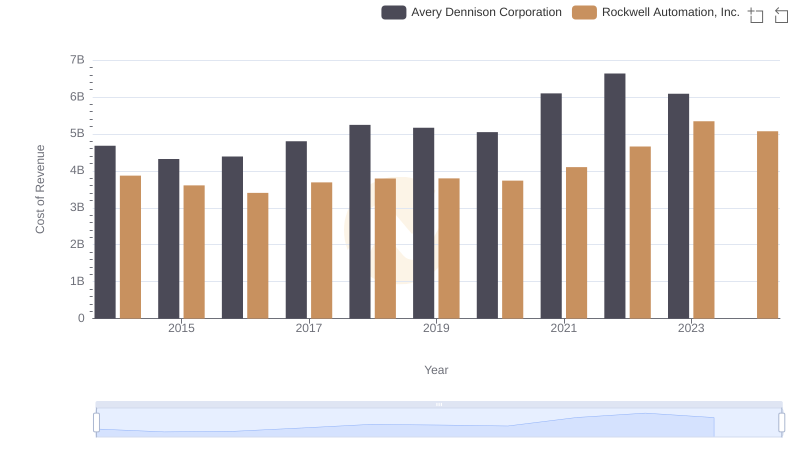
Analyzing Cost of Revenue: Rockwell Automation, Inc. and Avery Dennison Corporation
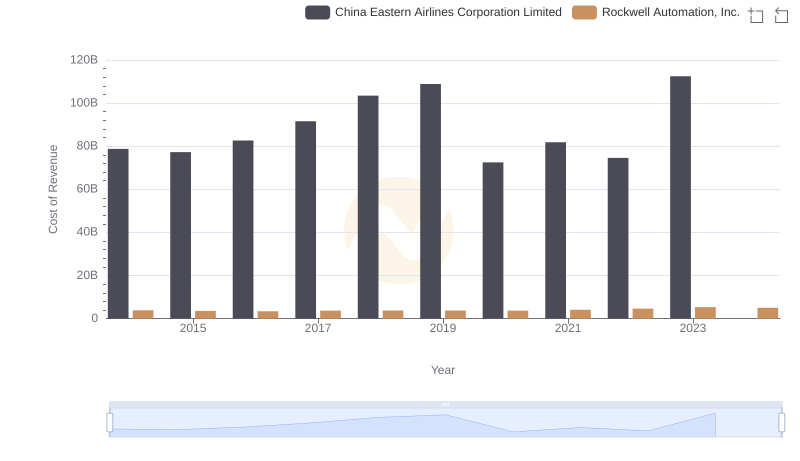
Cost of Revenue: Key Insights for Rockwell Automation, Inc. and China Eastern Airlines Corporation Limited
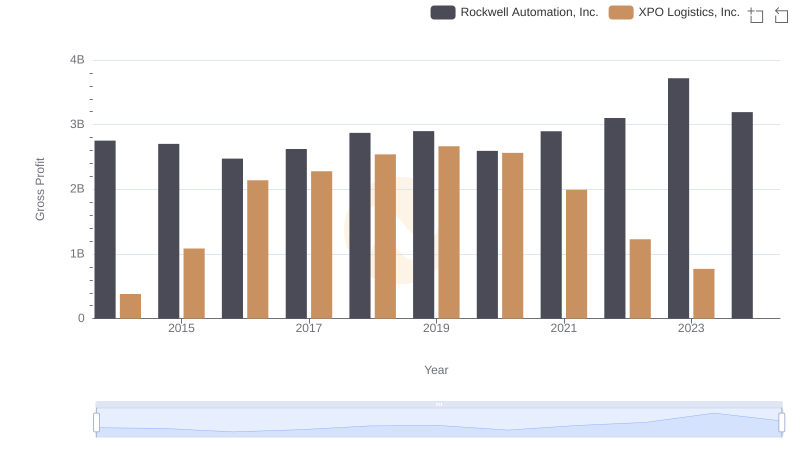
Gross Profit Trends Compared: Rockwell Automation, Inc. vs XPO Logistics, Inc.
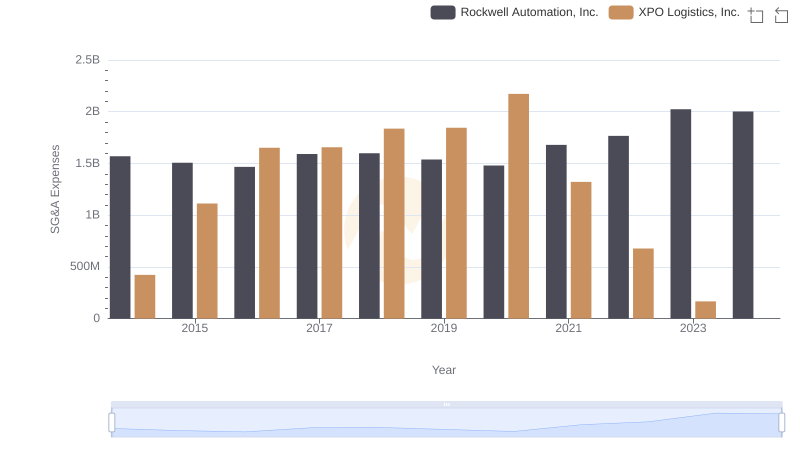
Rockwell Automation, Inc. or XPO Logistics, Inc.: Who Manages SG&A Costs Better?

Comprehensive EBITDA Comparison: Rockwell Automation, Inc. vs XPO Logistics, Inc.