| __timestamp | Expeditors International of Washington, Inc. | Rockwell Automation, Inc. |
|---|---|---|
| Wednesday, January 1, 2014 | 763996000 | 2753900000 |
| Thursday, January 1, 2015 | 895784000 | 2703100000 |
| Friday, January 1, 2016 | 850793000 | 2475500000 |
| Sunday, January 1, 2017 | 883027000 | 2624200000 |
| Monday, January 1, 2018 | 1020282000 | 2872200000 |
| Tuesday, January 1, 2019 | 997021000 | 2900100000 |
| Wednesday, January 1, 2020 | 1162765000 | 2595200000 |
| Friday, January 1, 2021 | 2165412000 | 2897700000 |
| Saturday, January 1, 2022 | 2171130000 | 3102000000 |
| Sunday, January 1, 2023 | 1245476000 | 3717000000 |
| Monday, January 1, 2024 | 10600515000 | 3193400000 |
Data in motion
In the ever-evolving landscape of industrial automation and logistics, Rockwell Automation, Inc. and Expeditors International of Washington, Inc. have emerged as formidable players. Over the past decade, Rockwell Automation has consistently outperformed Expeditors in terms of gross profit, showcasing a robust growth trajectory. From 2014 to 2023, Rockwell's gross profit surged by approximately 35%, peaking in 2023 with a remarkable 3.7 billion USD. In contrast, Expeditors experienced a more volatile journey, with a significant spike in 2021 and 2022, reaching over 2.1 billion USD, before dipping in 2023.
This comparison highlights the resilience and strategic prowess of Rockwell Automation in maintaining steady growth, while Expeditors' performance underscores the dynamic nature of the logistics industry. As we look to the future, the missing data for 2024 leaves room for speculation and anticipation about the next chapter in this financial narrative.
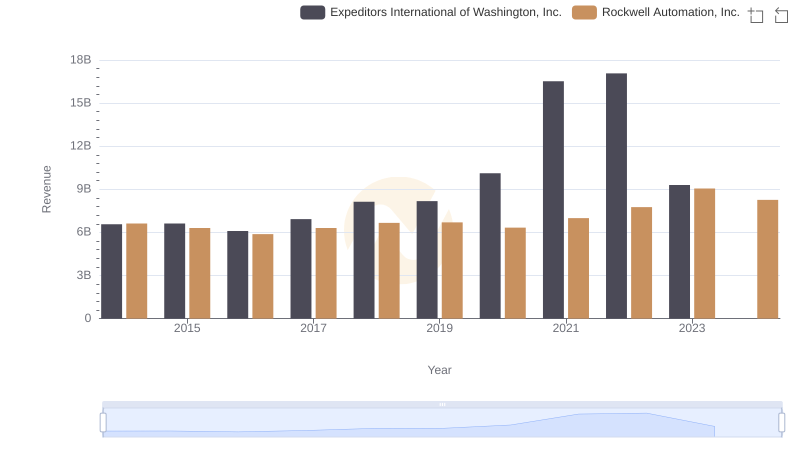
Comparing Revenue Performance: Rockwell Automation, Inc. or Expeditors International of Washington, Inc.?
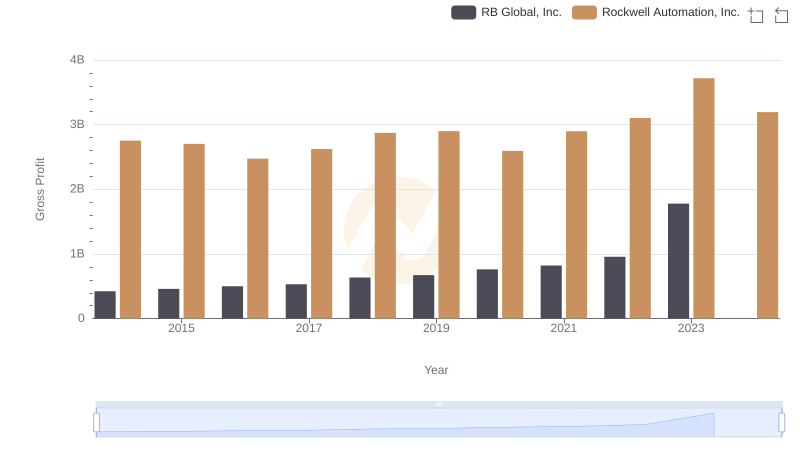
Gross Profit Trends Compared: Rockwell Automation, Inc. vs RB Global, Inc.
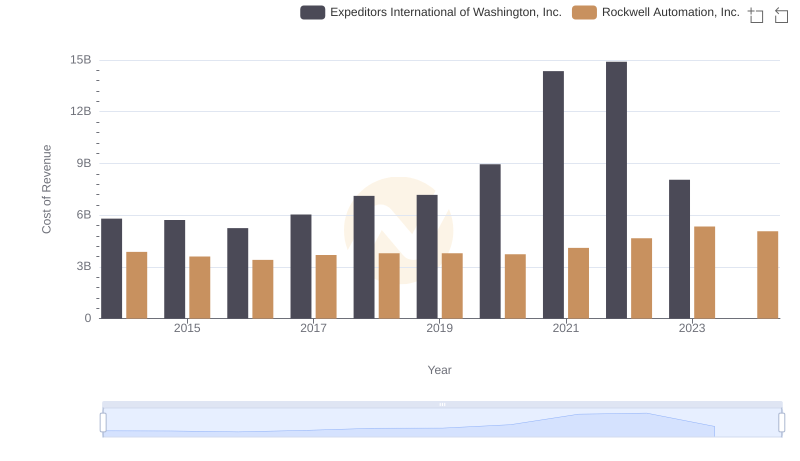
Analyzing Cost of Revenue: Rockwell Automation, Inc. and Expeditors International of Washington, Inc.
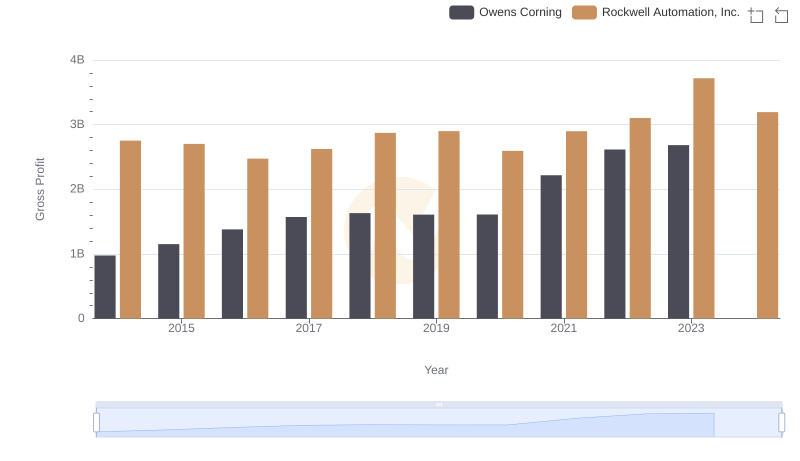
Gross Profit Trends Compared: Rockwell Automation, Inc. vs Owens Corning
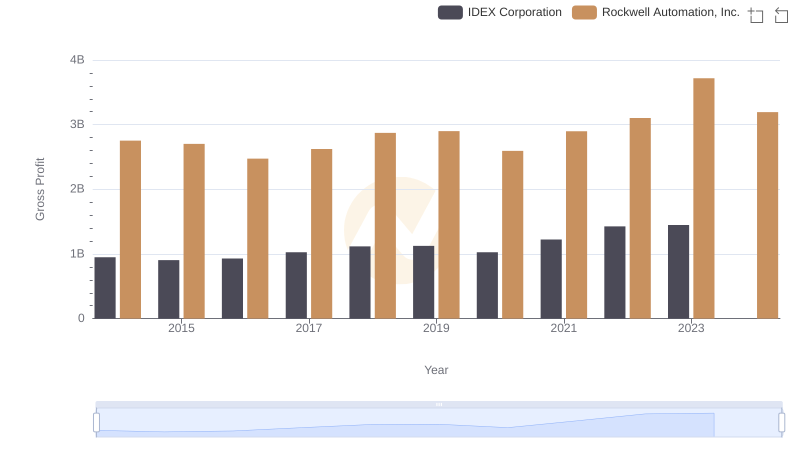
Rockwell Automation, Inc. and IDEX Corporation: A Detailed Gross Profit Analysis
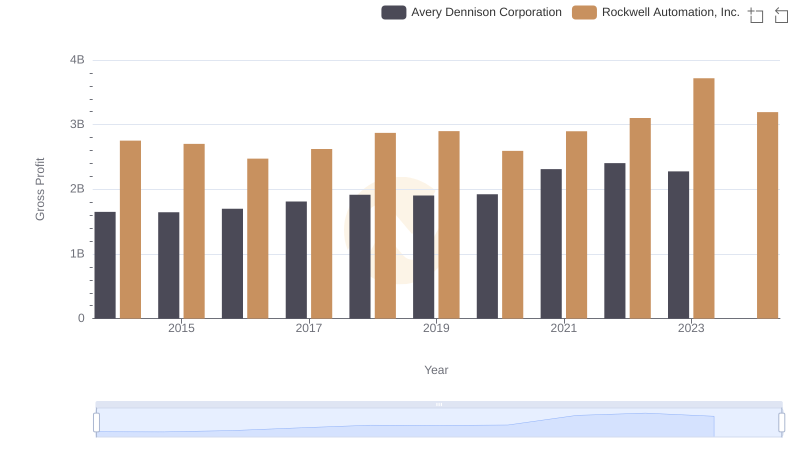
Gross Profit Trends Compared: Rockwell Automation, Inc. vs Avery Dennison Corporation
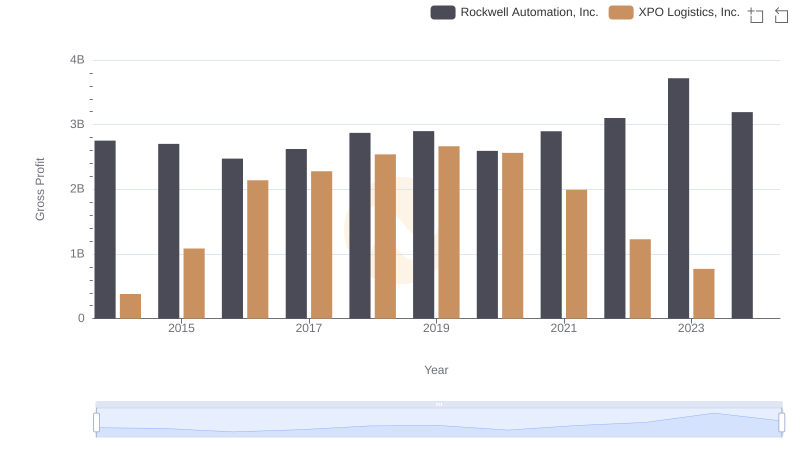
Gross Profit Trends Compared: Rockwell Automation, Inc. vs XPO Logistics, Inc.

Cost Management Insights: SG&A Expenses for Rockwell Automation, Inc. and Expeditors International of Washington, Inc.
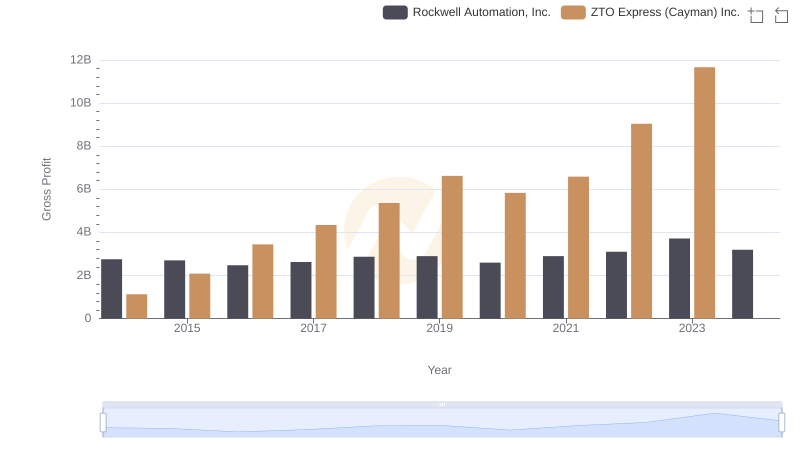
Key Insights on Gross Profit: Rockwell Automation, Inc. vs ZTO Express (Cayman) Inc.

A Professional Review of EBITDA: Rockwell Automation, Inc. Compared to Expeditors International of Washington, Inc.