| __timestamp | HEICO Corporation | Old Dominion Freight Line, Inc. |
|---|---|---|
| Wednesday, January 1, 2014 | 733999000 | 2100409000 |
| Thursday, January 1, 2015 | 754469000 | 2214943000 |
| Friday, January 1, 2016 | 860766000 | 2246890000 |
| Sunday, January 1, 2017 | 950088000 | 2482732000 |
| Monday, January 1, 2018 | 1087006000 | 2899452000 |
| Tuesday, January 1, 2019 | 1241807000 | 2938895000 |
| Wednesday, January 1, 2020 | 1104882000 | 2786531000 |
| Friday, January 1, 2021 | 1138259000 | 3481268000 |
| Saturday, January 1, 2022 | 1345563000 | 4003951000 |
| Sunday, January 1, 2023 | 1814617000 | 3793953000 |
| Monday, January 1, 2024 | 2355943000 |
Unleashing the power of data
In the competitive landscape of the transportation and aerospace industries, Old Dominion Freight Line, Inc. and HEICO Corporation have showcased intriguing cost of revenue trends over the past decade. From 2014 to 2023, Old Dominion Freight Line, Inc. saw a robust increase of approximately 80% in its cost of revenue, peaking in 2022. This reflects the company's aggressive expansion and operational scaling. Meanwhile, HEICO Corporation, a key player in aerospace, experienced a remarkable 220% surge, highlighting its strategic growth and innovation-driven approach.
While Old Dominion's cost of revenue reached its zenith in 2022, HEICO's upward trajectory continued into 2024, albeit with missing data for Old Dominion in that year. This divergence underscores the dynamic nature of these industries, where market conditions and strategic decisions play pivotal roles. As we look ahead, these trends offer valuable insights into the evolving strategies of these industry leaders.
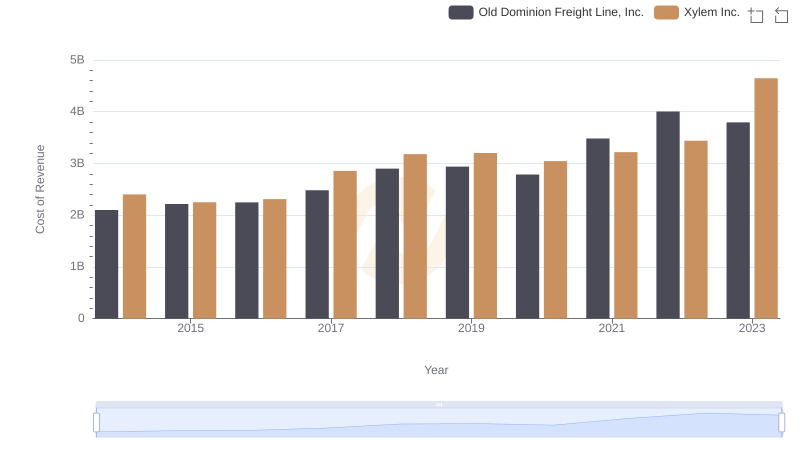
Cost Insights: Breaking Down Old Dominion Freight Line, Inc. and Xylem Inc.'s Expenses
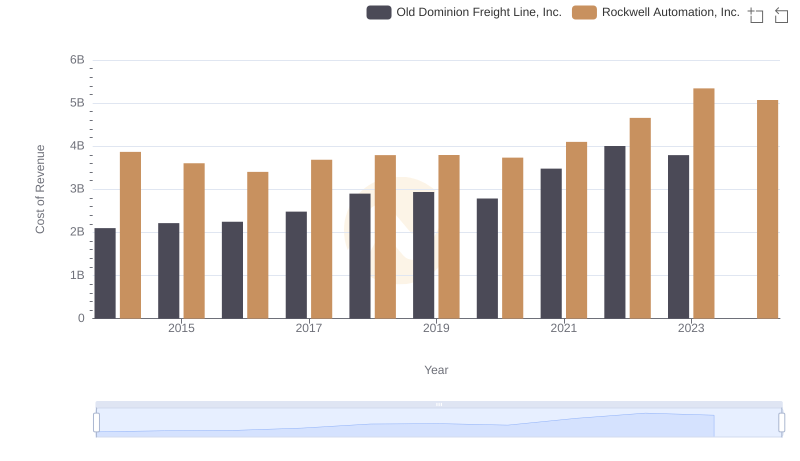
Comparing Cost of Revenue Efficiency: Old Dominion Freight Line, Inc. vs Rockwell Automation, Inc.
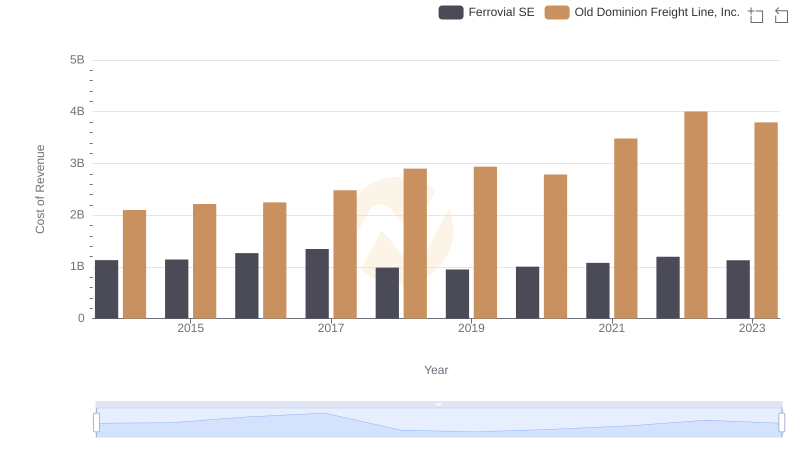
Analyzing Cost of Revenue: Old Dominion Freight Line, Inc. and Ferrovial SE
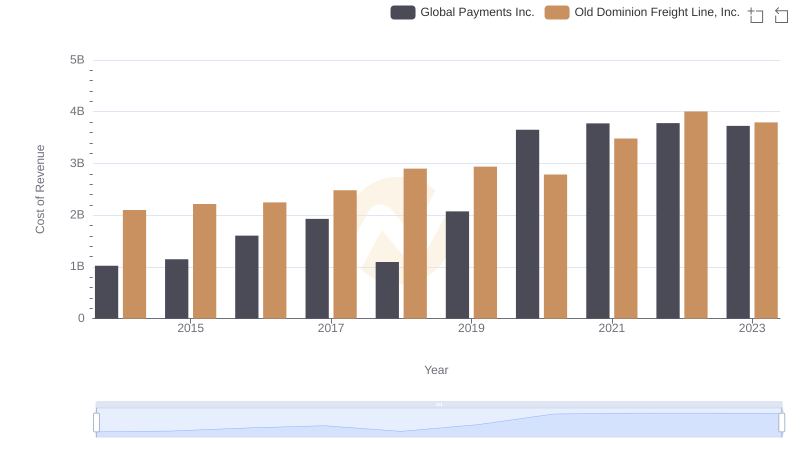
Comparing Cost of Revenue Efficiency: Old Dominion Freight Line, Inc. vs Global Payments Inc.
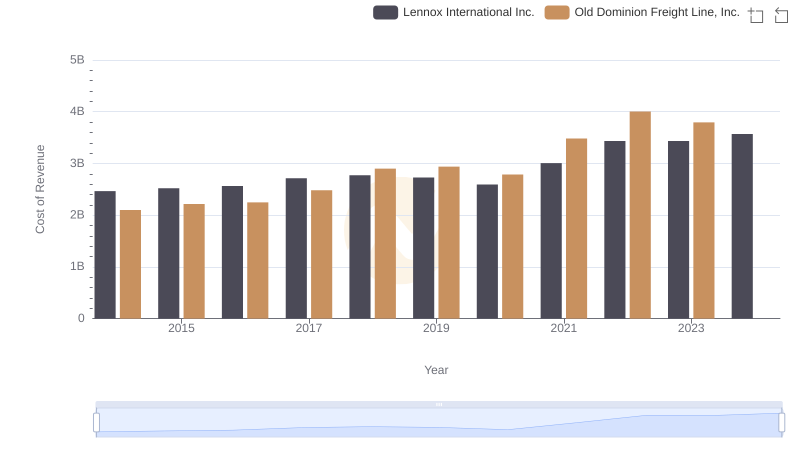
Cost of Revenue Comparison: Old Dominion Freight Line, Inc. vs Lennox International Inc.
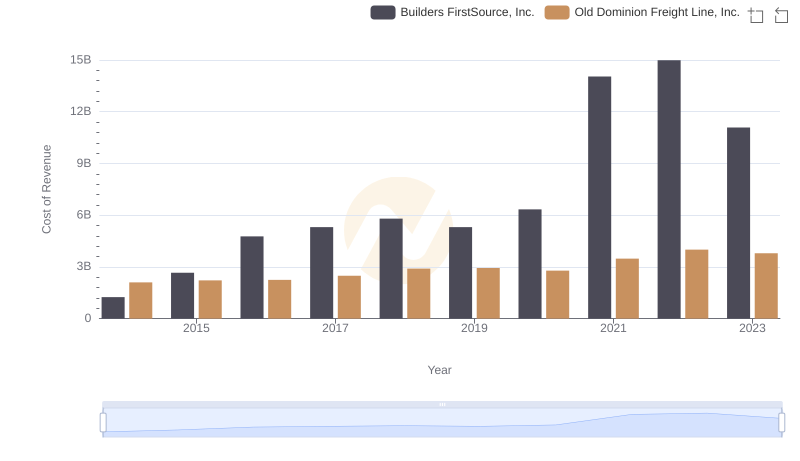
Cost Insights: Breaking Down Old Dominion Freight Line, Inc. and Builders FirstSource, Inc.'s Expenses
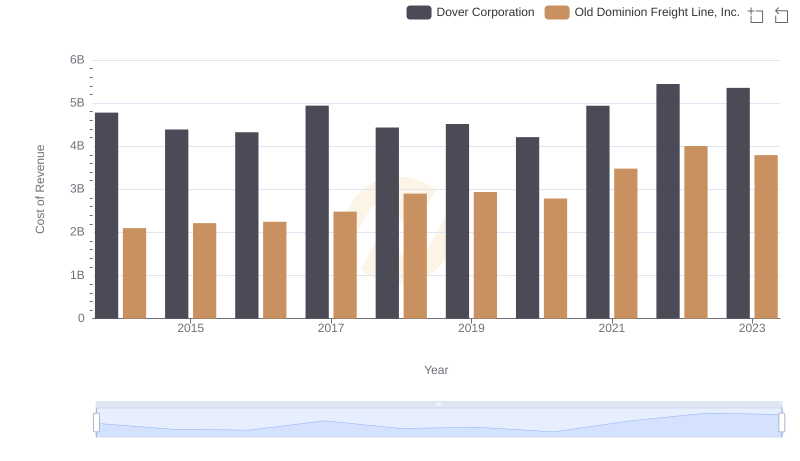
Cost of Revenue Comparison: Old Dominion Freight Line, Inc. vs Dover Corporation
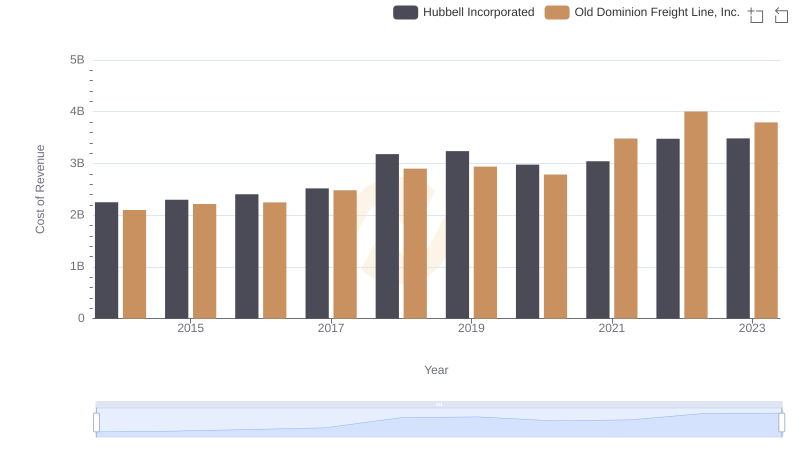
Cost of Revenue: Key Insights for Old Dominion Freight Line, Inc. and Hubbell Incorporated

Old Dominion Freight Line, Inc. and HEICO Corporation: A Detailed Gross Profit Analysis
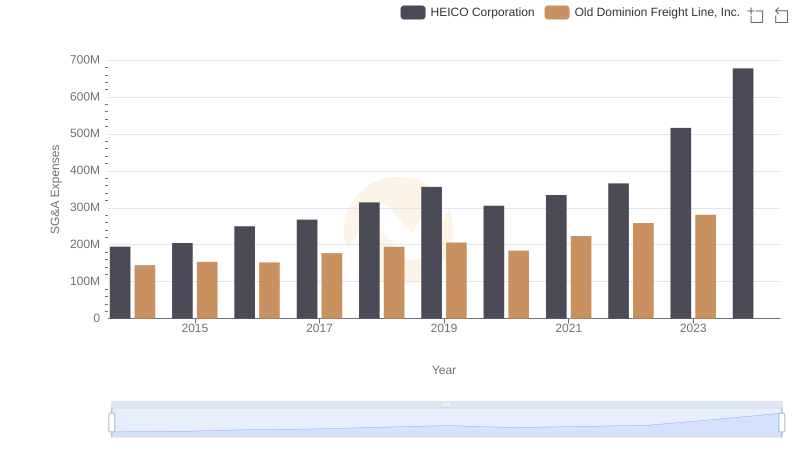
Selling, General, and Administrative Costs: Old Dominion Freight Line, Inc. vs HEICO Corporation
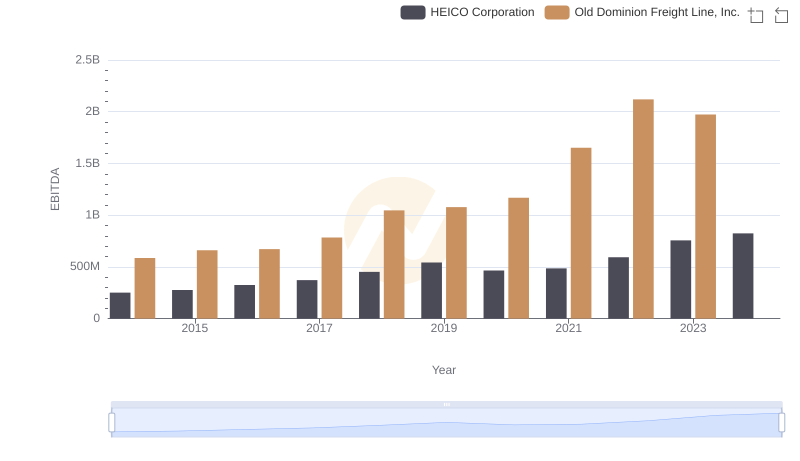
EBITDA Performance Review: Old Dominion Freight Line, Inc. vs HEICO Corporation