| __timestamp | Old Dominion Freight Line, Inc. | Xylem Inc. |
|---|---|---|
| Wednesday, January 1, 2014 | 2100409000 | 2403000000 |
| Thursday, January 1, 2015 | 2214943000 | 2249000000 |
| Friday, January 1, 2016 | 2246890000 | 2310000000 |
| Sunday, January 1, 2017 | 2482732000 | 2856000000 |
| Monday, January 1, 2018 | 2899452000 | 3181000000 |
| Tuesday, January 1, 2019 | 2938895000 | 3203000000 |
| Wednesday, January 1, 2020 | 2786531000 | 3046000000 |
| Friday, January 1, 2021 | 3481268000 | 3220000000 |
| Saturday, January 1, 2022 | 4003951000 | 3438000000 |
| Sunday, January 1, 2023 | 3793953000 | 4647000000 |
Unleashing insights
In the ever-evolving landscape of logistics and water technology, understanding cost structures is crucial. Old Dominion Freight Line, Inc. and Xylem Inc. have shown distinct trends in their cost of revenue over the past decade. From 2014 to 2023, Old Dominion's cost of revenue surged by approximately 81%, peaking in 2022. Meanwhile, Xylem Inc. experienced a 93% increase, with a notable spike in 2023. This data highlights the dynamic nature of operational expenses in these industries. Old Dominion's costs reflect its expansion and increased freight demand, while Xylem's rise aligns with its strategic investments in sustainable water solutions. As these companies navigate economic shifts, their cost management strategies will be pivotal in maintaining competitive edges. This analysis offers a window into the financial health and strategic priorities of two industry leaders.
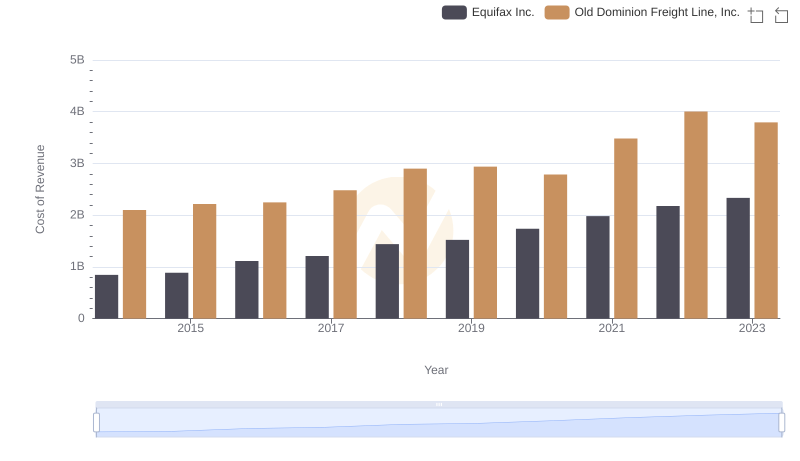
Cost of Revenue: Key Insights for Old Dominion Freight Line, Inc. and Equifax Inc.
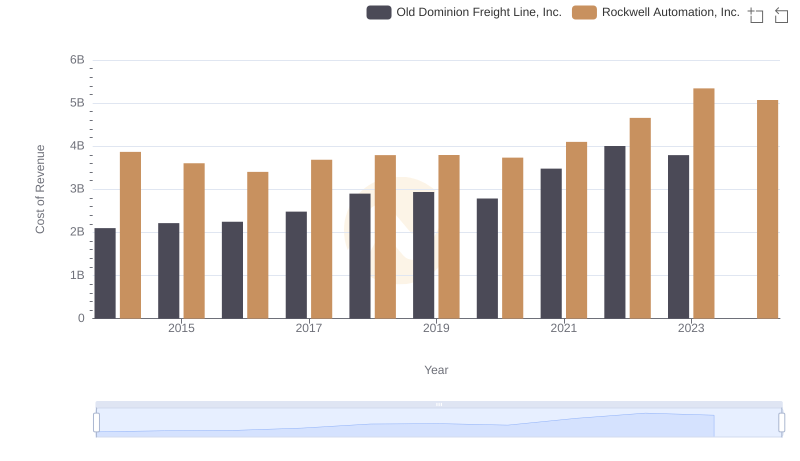
Comparing Cost of Revenue Efficiency: Old Dominion Freight Line, Inc. vs Rockwell Automation, Inc.
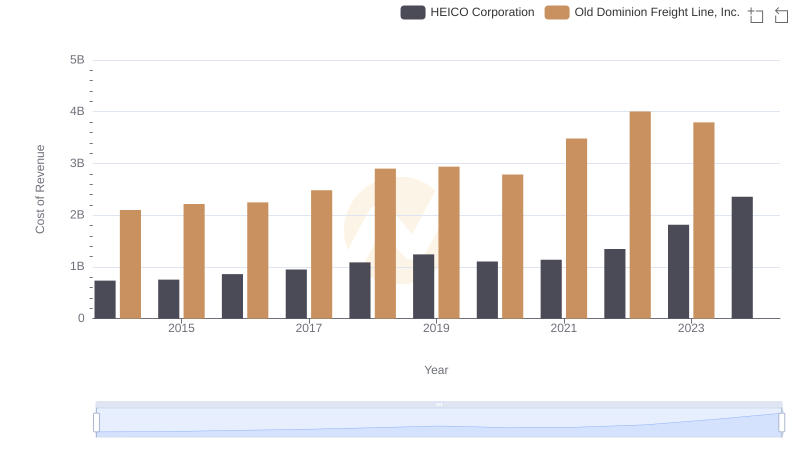
Cost of Revenue Trends: Old Dominion Freight Line, Inc. vs HEICO Corporation
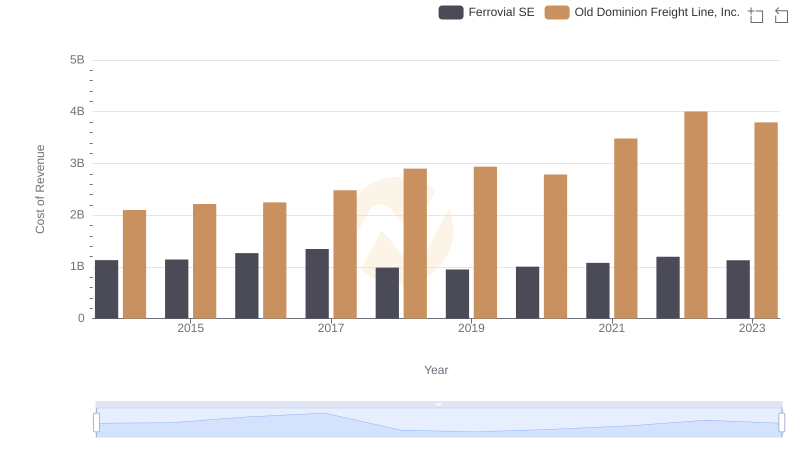
Analyzing Cost of Revenue: Old Dominion Freight Line, Inc. and Ferrovial SE
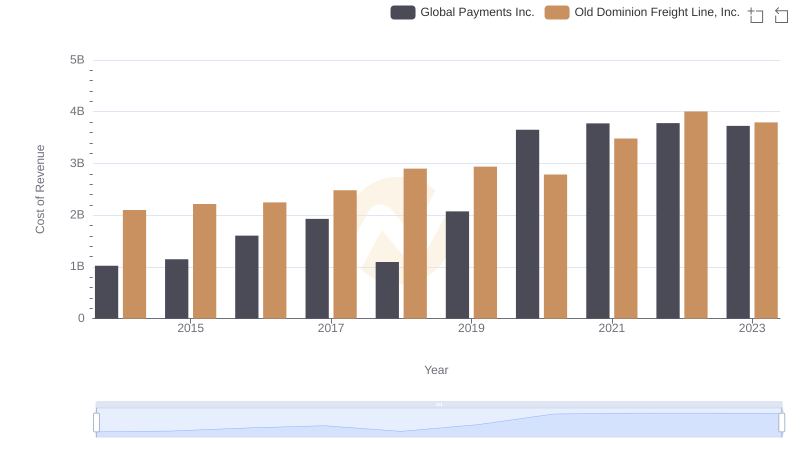
Comparing Cost of Revenue Efficiency: Old Dominion Freight Line, Inc. vs Global Payments Inc.
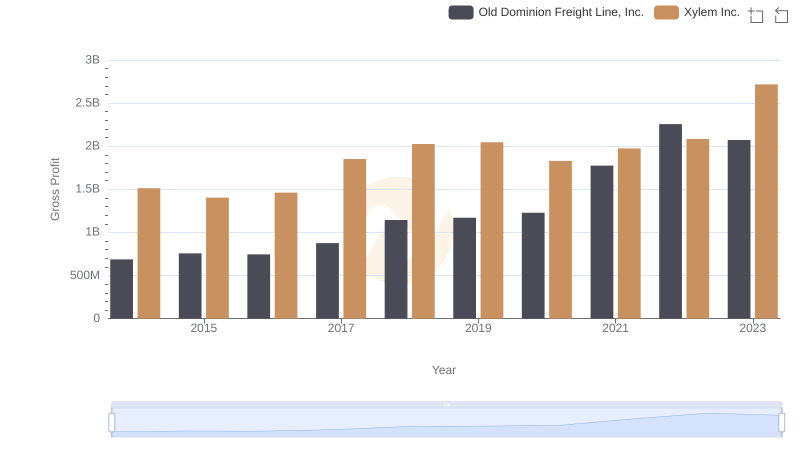
Who Generates Higher Gross Profit? Old Dominion Freight Line, Inc. or Xylem Inc.
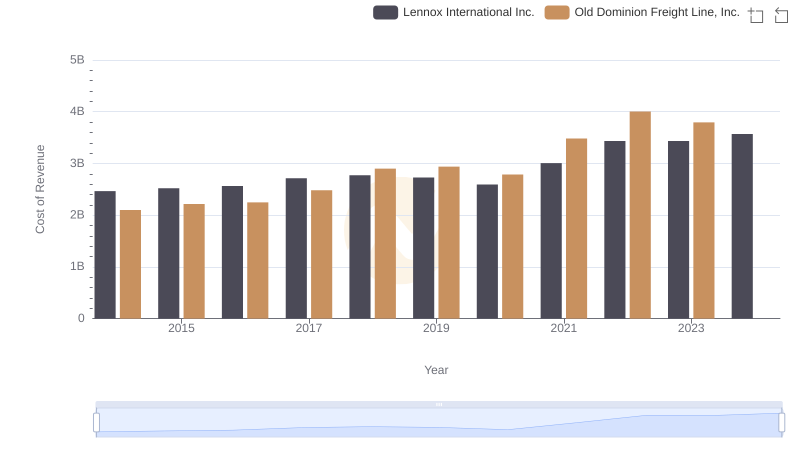
Cost of Revenue Comparison: Old Dominion Freight Line, Inc. vs Lennox International Inc.
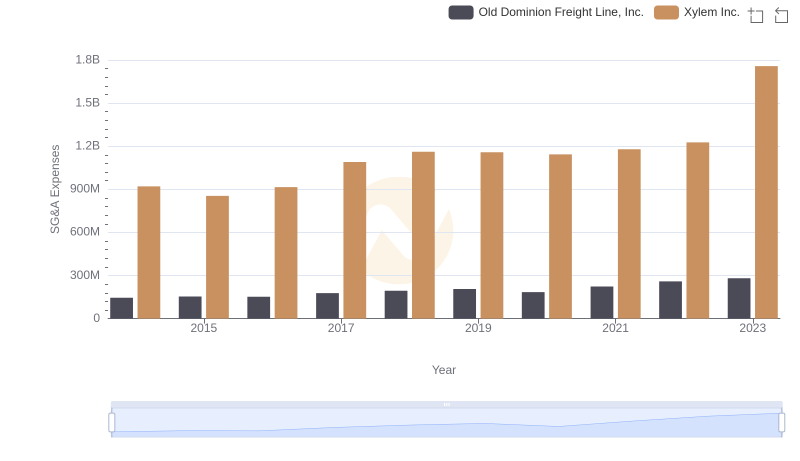
Operational Costs Compared: SG&A Analysis of Old Dominion Freight Line, Inc. and Xylem Inc.
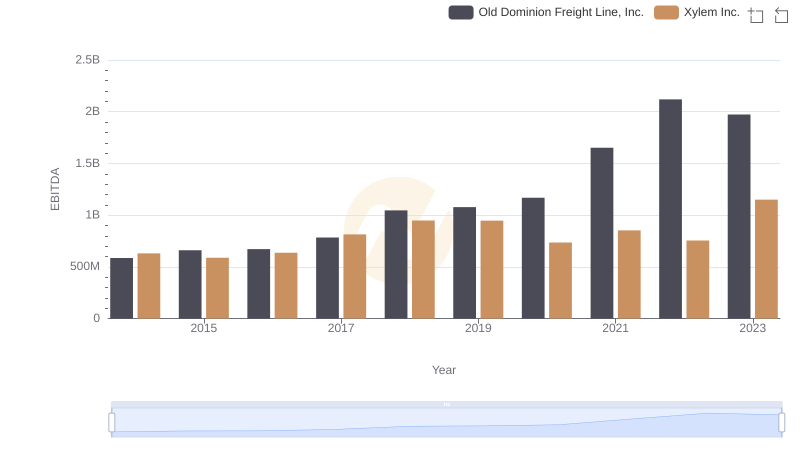
Old Dominion Freight Line, Inc. and Xylem Inc.: A Detailed Examination of EBITDA Performance