| __timestamp | Ferrovial SE | Old Dominion Freight Line, Inc. |
|---|---|---|
| Wednesday, January 1, 2014 | 983000000 | 585590000 |
| Thursday, January 1, 2015 | 1027000000 | 660570000 |
| Friday, January 1, 2016 | 943000000 | 671786000 |
| Sunday, January 1, 2017 | 515000000 | 783749000 |
| Monday, January 1, 2018 | 661000000 | 1046059000 |
| Tuesday, January 1, 2019 | 121000000 | 1078007000 |
| Wednesday, January 1, 2020 | 116000000 | 1168149000 |
| Friday, January 1, 2021 | 610000000 | 1651501000 |
| Saturday, January 1, 2022 | 756000000 | 2118962000 |
| Sunday, January 1, 2023 | 1524000000 | 1972689000 |
In pursuit of knowledge
In the ever-evolving landscape of global logistics and infrastructure, understanding the financial health of industry giants is crucial. This analysis pits Old Dominion Freight Line, Inc., a leader in freight transportation, against Ferrovial SE, a titan in infrastructure development, by examining their EBITDA from 2014 to 2023.
Old Dominion Freight Line has demonstrated a robust growth trajectory, with its EBITDA surging by approximately 237% over the decade. Notably, in 2022, it reached a peak of nearly $2.12 billion, underscoring its resilience and strategic prowess in the freight sector. In contrast, Ferrovial SE, despite facing fluctuations, achieved a remarkable recovery in 2023, with its EBITDA climbing to $1.52 billion, marking a 58% increase from its 2020 low.
This financial duel highlights the dynamic nature of these industries, where strategic investments and market adaptability are key to sustained growth.
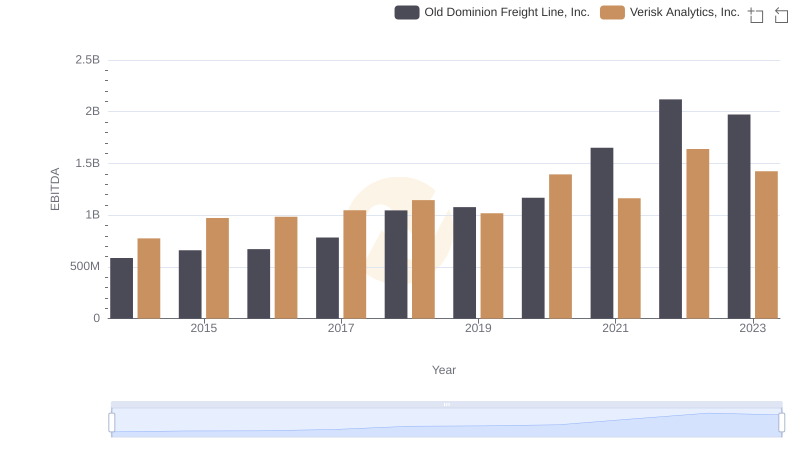
Comparative EBITDA Analysis: Old Dominion Freight Line, Inc. vs Verisk Analytics, Inc.
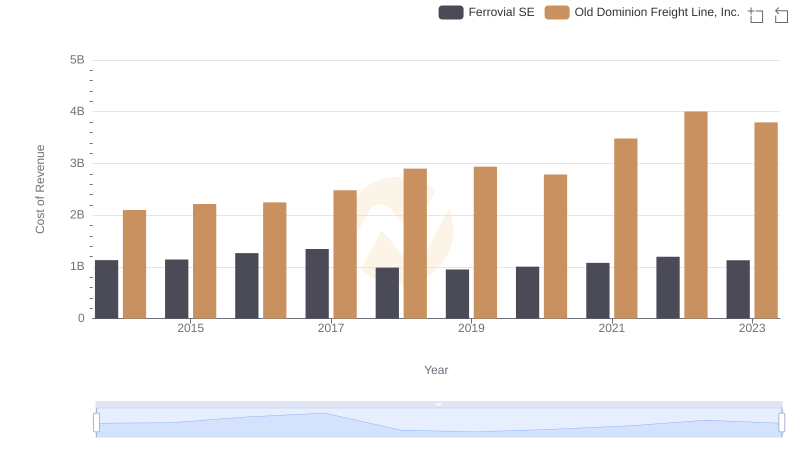
Analyzing Cost of Revenue: Old Dominion Freight Line, Inc. and Ferrovial SE
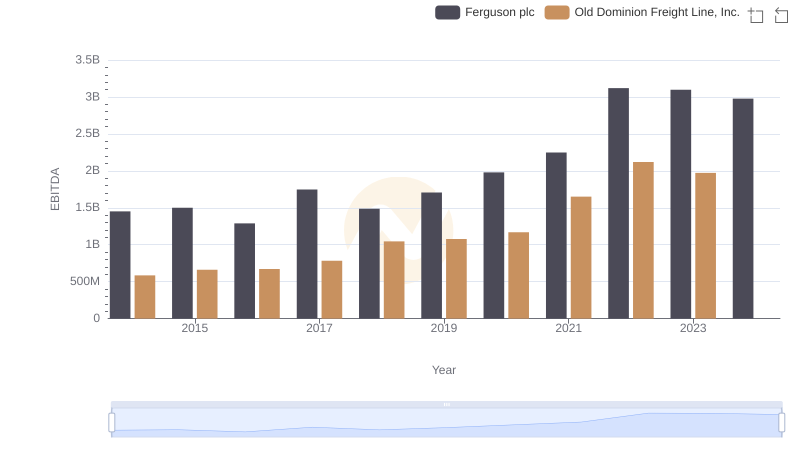
Old Dominion Freight Line, Inc. vs Ferguson plc: In-Depth EBITDA Performance Comparison
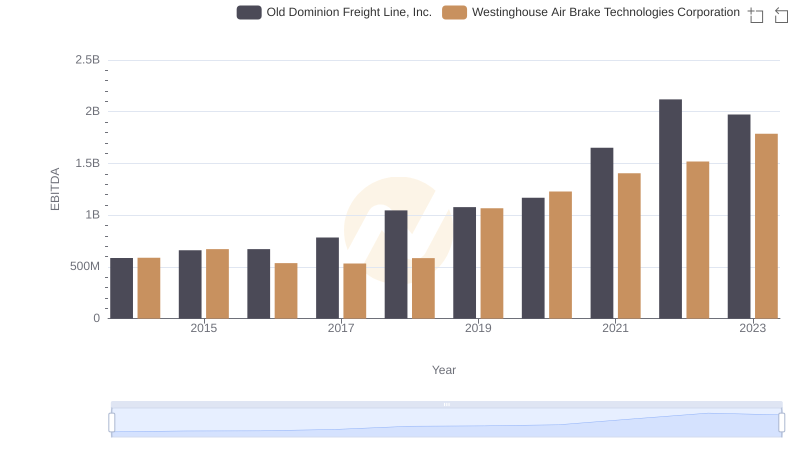
Old Dominion Freight Line, Inc. vs Westinghouse Air Brake Technologies Corporation: In-Depth EBITDA Performance Comparison
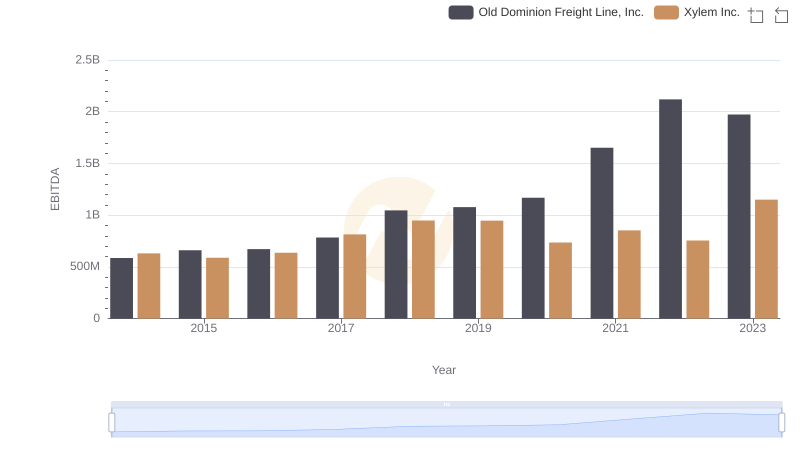
Old Dominion Freight Line, Inc. and Xylem Inc.: A Detailed Examination of EBITDA Performance
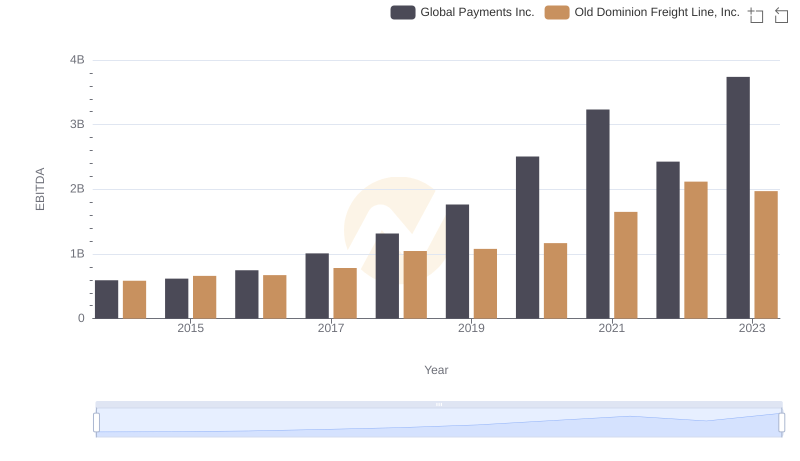
EBITDA Analysis: Evaluating Old Dominion Freight Line, Inc. Against Global Payments Inc.
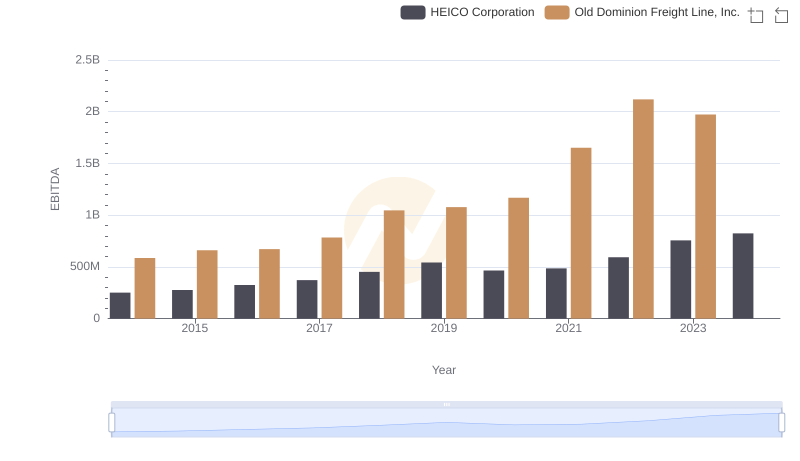
EBITDA Performance Review: Old Dominion Freight Line, Inc. vs HEICO Corporation
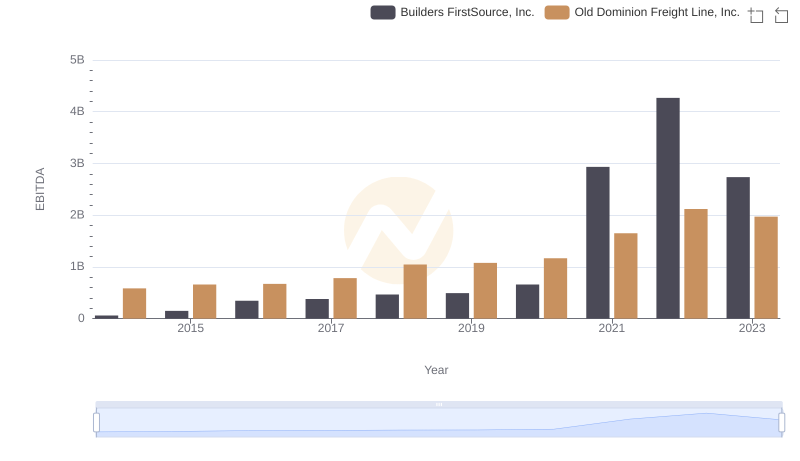
Comprehensive EBITDA Comparison: Old Dominion Freight Line, Inc. vs Builders FirstSource, Inc.