| __timestamp | Comfort Systems USA, Inc. | Old Dominion Freight Line, Inc. |
|---|---|---|
| Wednesday, January 1, 2014 | 207652000 | 144817000 |
| Thursday, January 1, 2015 | 228965000 | 153589000 |
| Friday, January 1, 2016 | 243201000 | 152391000 |
| Sunday, January 1, 2017 | 266586000 | 177205000 |
| Monday, January 1, 2018 | 296986000 | 194368000 |
| Tuesday, January 1, 2019 | 340005000 | 206125000 |
| Wednesday, January 1, 2020 | 357777000 | 184185000 |
| Friday, January 1, 2021 | 376309000 | 223757000 |
| Saturday, January 1, 2022 | 489344000 | 258883000 |
| Sunday, January 1, 2023 | 536188999 | 281053000 |
Unveiling the hidden dimensions of data
In the competitive landscape of the logistics and construction industries, understanding the financial health of companies is crucial. This chart provides a fascinating comparison of Selling, General, and Administrative (SG&A) expenses between Old Dominion Freight Line, Inc. and Comfort Systems USA, Inc. from 2014 to 2023.
Comfort Systems USA, Inc. has consistently outpaced Old Dominion Freight Line, Inc. in SG&A expenses, with a notable increase of approximately 158% over the decade. In 2023, Comfort Systems USA, Inc.'s SG&A expenses reached a peak, nearly doubling from their 2014 levels. Meanwhile, Old Dominion Freight Line, Inc. saw a more modest growth of around 94% in the same period.
This trend highlights the differing operational strategies and market dynamics faced by these companies. As Comfort Systems USA, Inc. expands its footprint, its higher SG&A expenses may reflect strategic investments in growth and infrastructure.
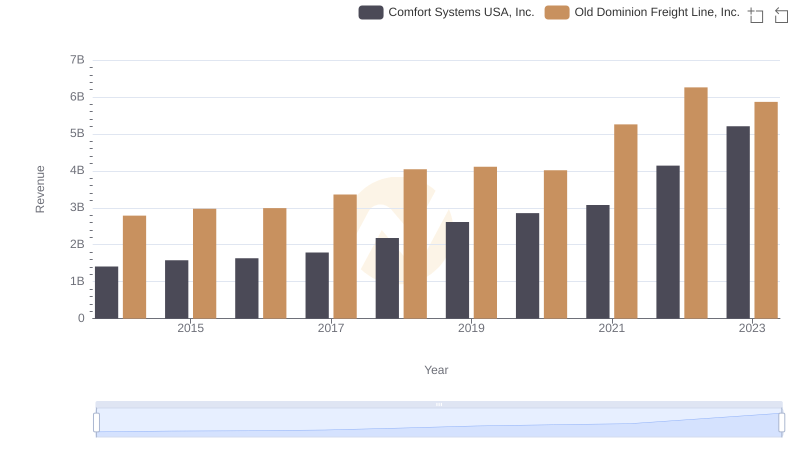
Breaking Down Revenue Trends: Old Dominion Freight Line, Inc. vs Comfort Systems USA, Inc.
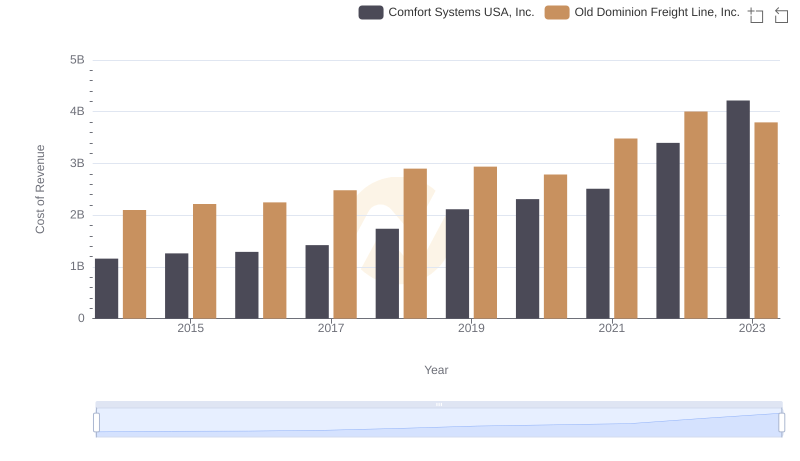
Analyzing Cost of Revenue: Old Dominion Freight Line, Inc. and Comfort Systems USA, Inc.
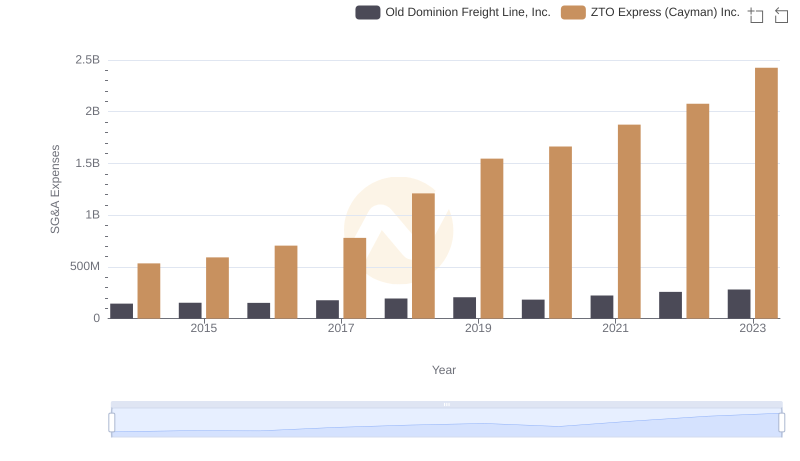
Comparing SG&A Expenses: Old Dominion Freight Line, Inc. vs ZTO Express (Cayman) Inc. Trends and Insights
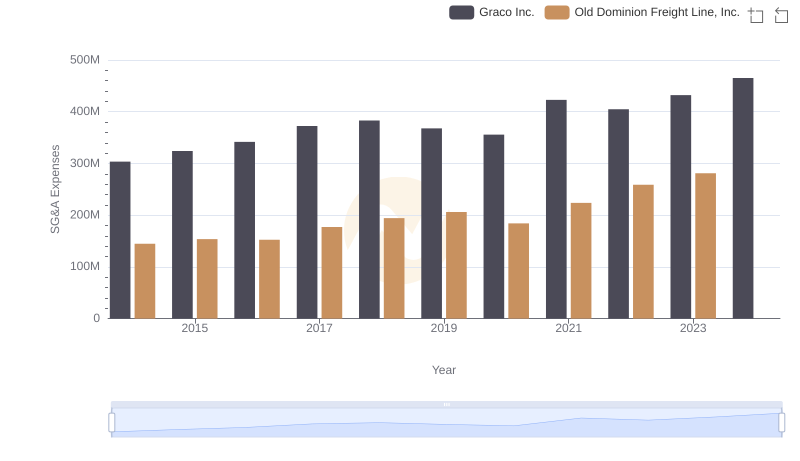
Old Dominion Freight Line, Inc. vs Graco Inc.: SG&A Expense Trends
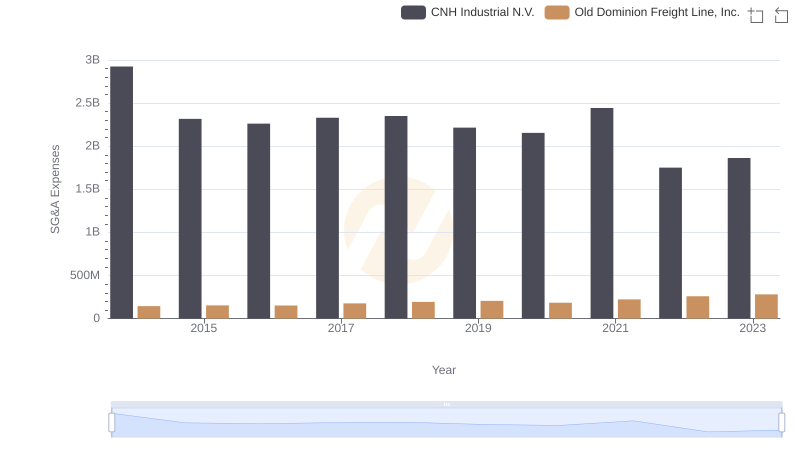
Who Optimizes SG&A Costs Better? Old Dominion Freight Line, Inc. or CNH Industrial N.V.
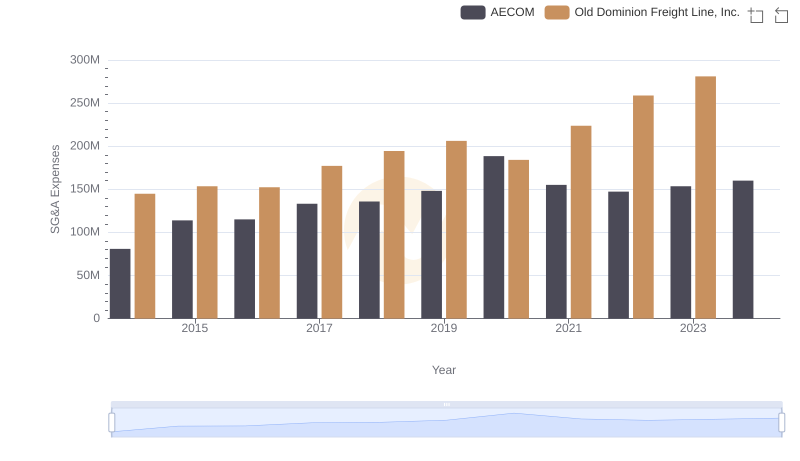
Comparing SG&A Expenses: Old Dominion Freight Line, Inc. vs AECOM Trends and Insights
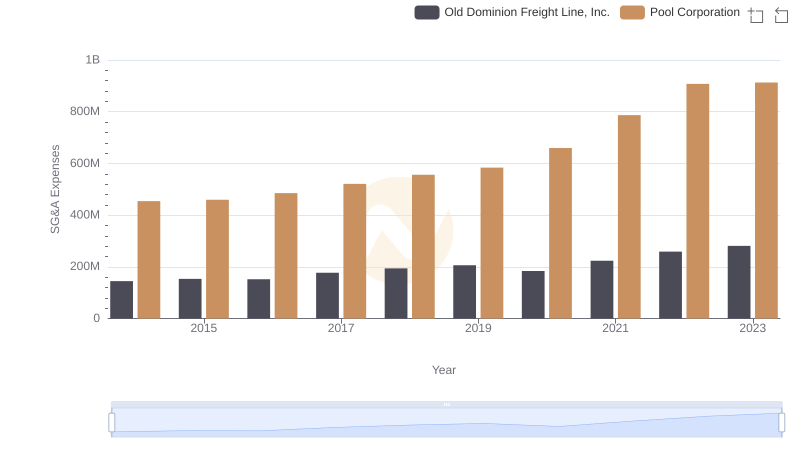
Operational Costs Compared: SG&A Analysis of Old Dominion Freight Line, Inc. and Pool Corporation
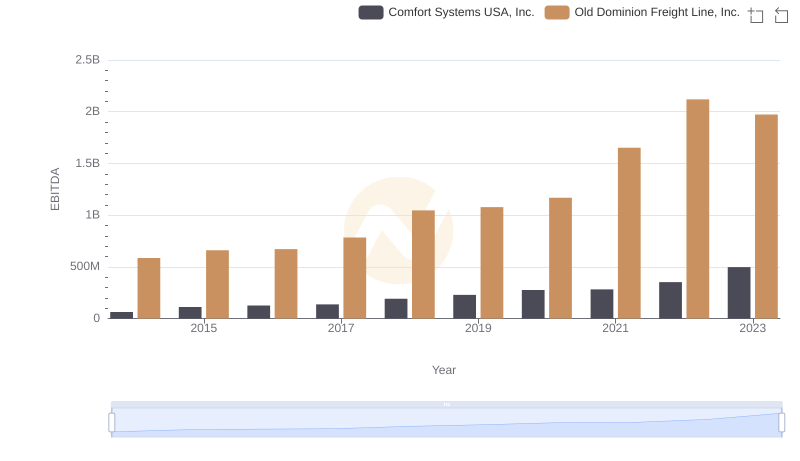
Professional EBITDA Benchmarking: Old Dominion Freight Line, Inc. vs Comfort Systems USA, Inc.
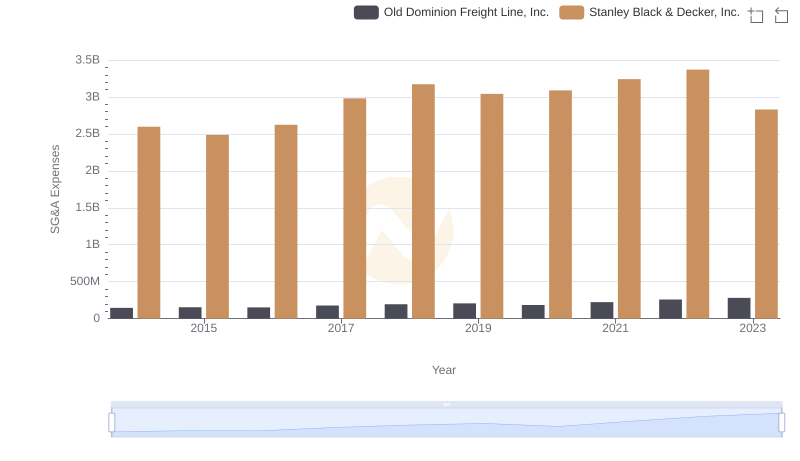
SG&A Efficiency Analysis: Comparing Old Dominion Freight Line, Inc. and Stanley Black & Decker, Inc.
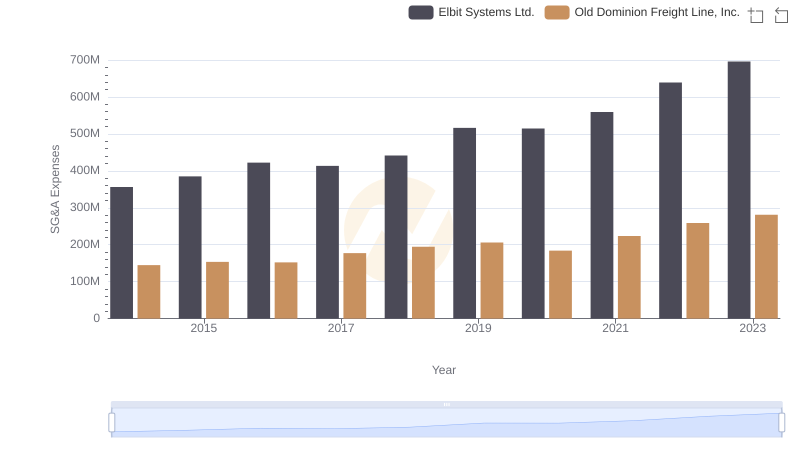
Cost Management Insights: SG&A Expenses for Old Dominion Freight Line, Inc. and Elbit Systems Ltd.