| __timestamp | Fiserv, Inc. | International Business Machines Corporation |
|---|---|---|
| Wednesday, January 1, 2014 | 2881000000 | 46386000000 |
| Thursday, January 1, 2015 | 2909000000 | 41057000000 |
| Friday, January 1, 2016 | 2959000000 | 41403000000 |
| Sunday, January 1, 2017 | 3024000000 | 42196000000 |
| Monday, January 1, 2018 | 3069000000 | 42655000000 |
| Tuesday, January 1, 2019 | 5309000000 | 26181000000 |
| Wednesday, January 1, 2020 | 7812000000 | 24314000000 |
| Friday, January 1, 2021 | 8128000000 | 25865000000 |
| Saturday, January 1, 2022 | 7992000000 | 27842000000 |
| Sunday, January 1, 2023 | 7670000000 | 27560000000 |
| Monday, January 1, 2024 | 0 | 27202000000 |
Infusing magic into the data realm
In the ever-evolving landscape of technology and financial services, understanding cost structures is crucial. From 2014 to 2023, International Business Machines Corporation (IBM) and Fiserv, Inc. have shown distinct trends in their cost of revenue. IBM, a stalwart in the tech industry, has seen its cost of revenue decrease by approximately 41% over this period, reflecting strategic shifts and operational efficiencies. In contrast, Fiserv, a leader in financial technology, experienced a significant increase of around 166%, highlighting its aggressive expansion and adaptation to market demands.
The data reveals a pivotal year in 2019 when Fiserv's cost of revenue surged by 75%, coinciding with its acquisition of First Data. Meanwhile, IBM's cost of revenue saw a notable decline in 2021, aligning with its focus on cloud computing and AI. These trends underscore the dynamic nature of these industries and the strategic maneuvers companies must make to stay competitive.
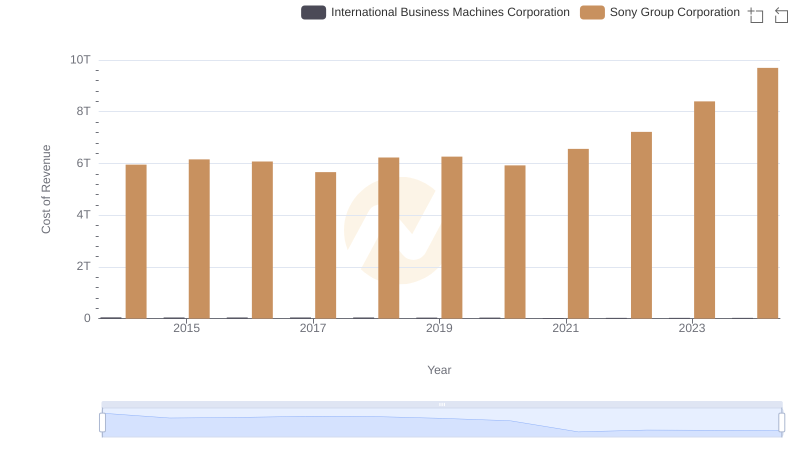
Cost of Revenue: Key Insights for International Business Machines Corporation and Sony Group Corporation
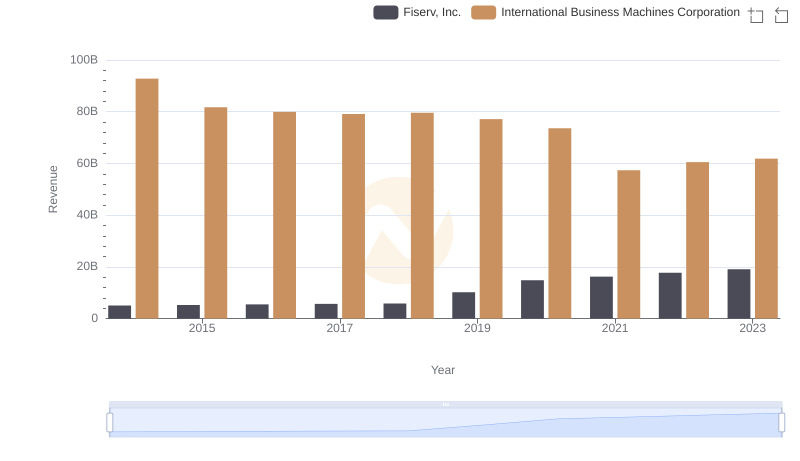
Breaking Down Revenue Trends: International Business Machines Corporation vs Fiserv, Inc.
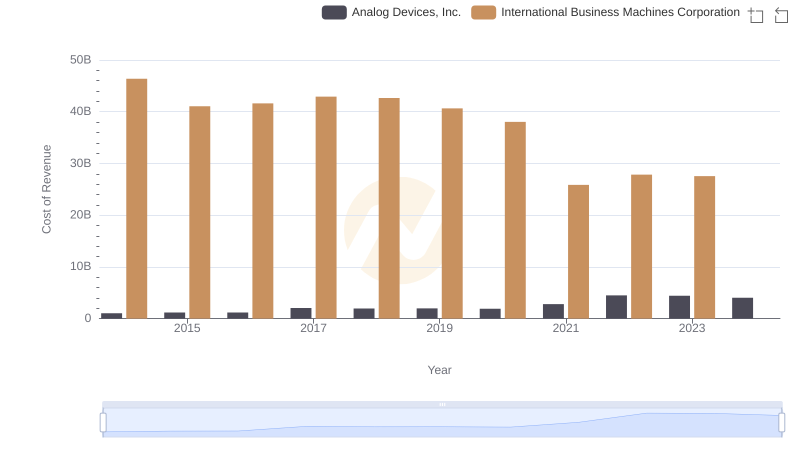
Comparing Cost of Revenue Efficiency: International Business Machines Corporation vs Analog Devices, Inc.
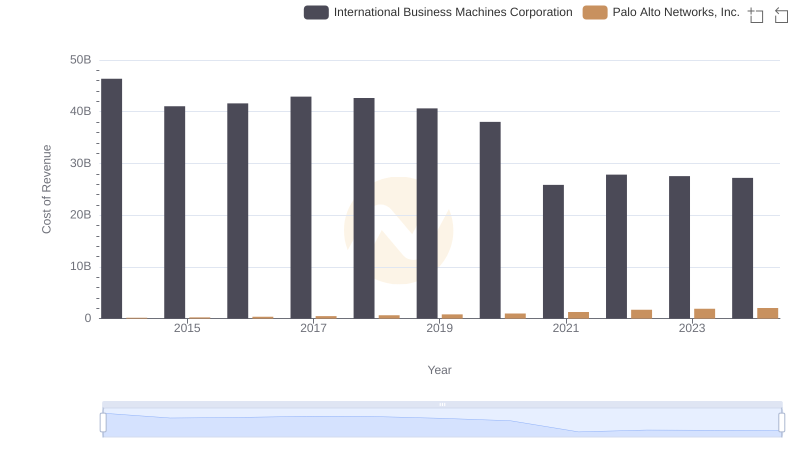
Comparing Cost of Revenue Efficiency: International Business Machines Corporation vs Palo Alto Networks, Inc.
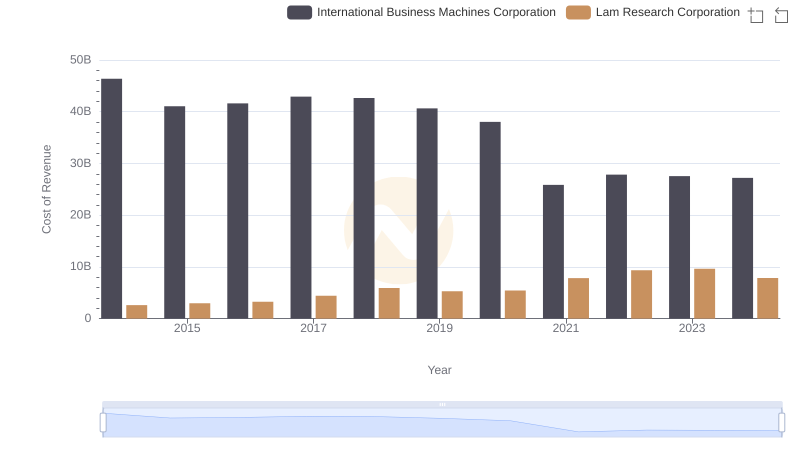
Analyzing Cost of Revenue: International Business Machines Corporation and Lam Research Corporation
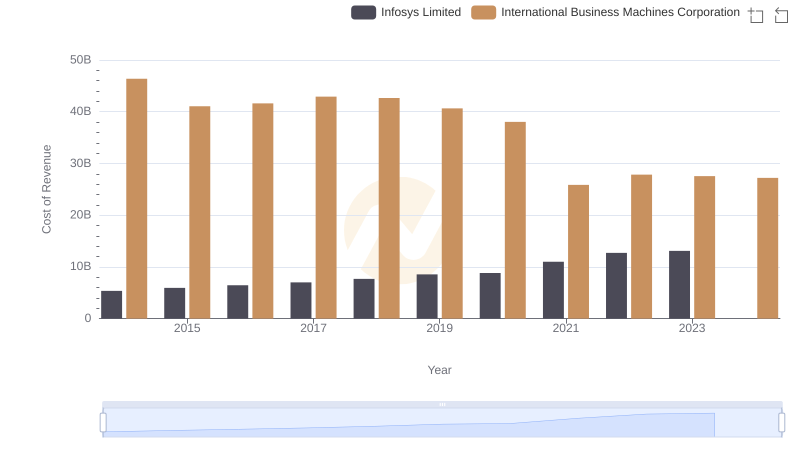
International Business Machines Corporation vs Infosys Limited: Efficiency in Cost of Revenue Explored
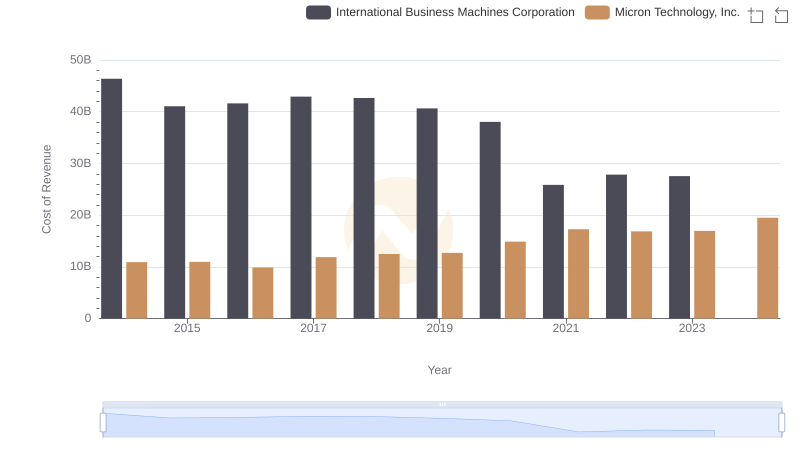
Cost of Revenue: Key Insights for International Business Machines Corporation and Micron Technology, Inc.
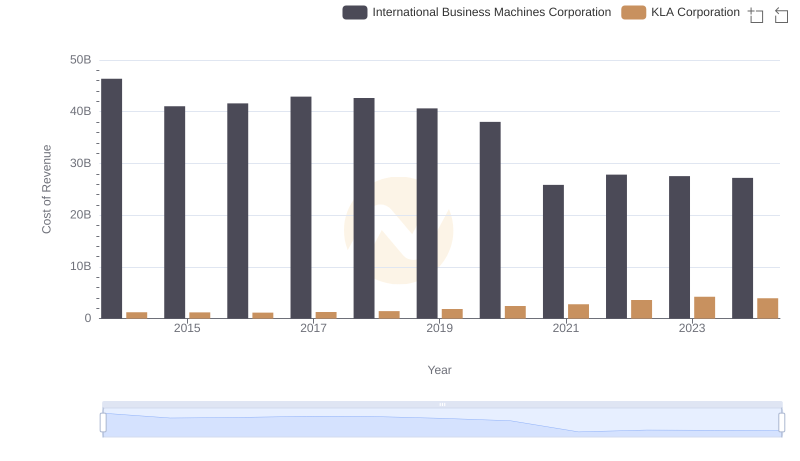
Cost Insights: Breaking Down International Business Machines Corporation and KLA Corporation's Expenses
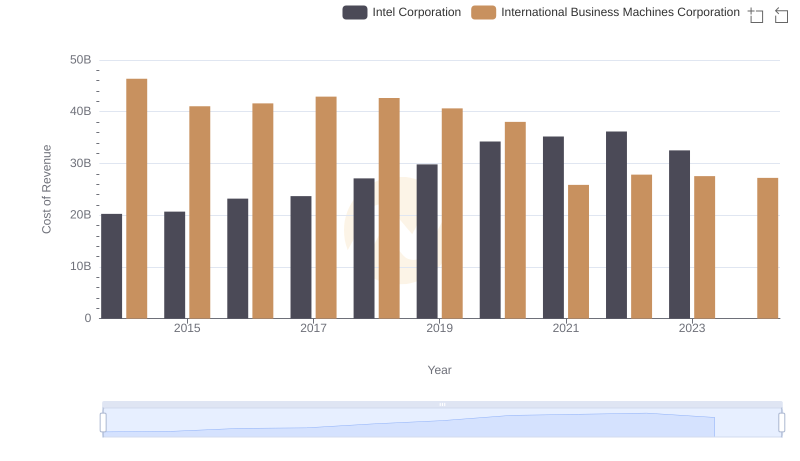
Cost Insights: Breaking Down International Business Machines Corporation and Intel Corporation's Expenses
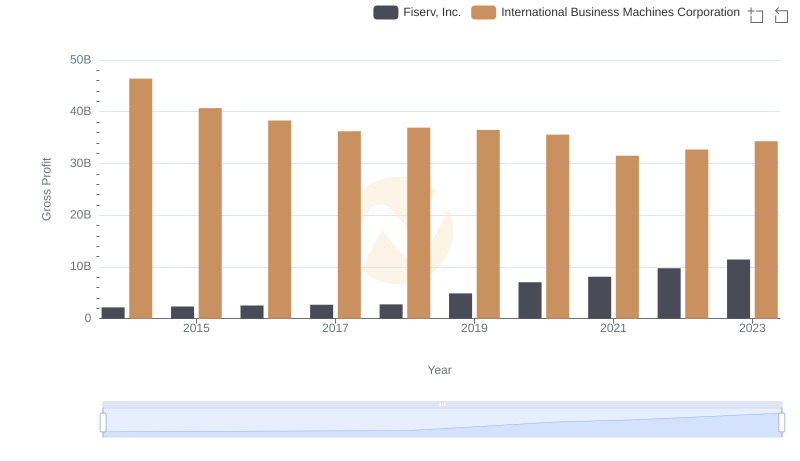
Key Insights on Gross Profit: International Business Machines Corporation vs Fiserv, Inc.
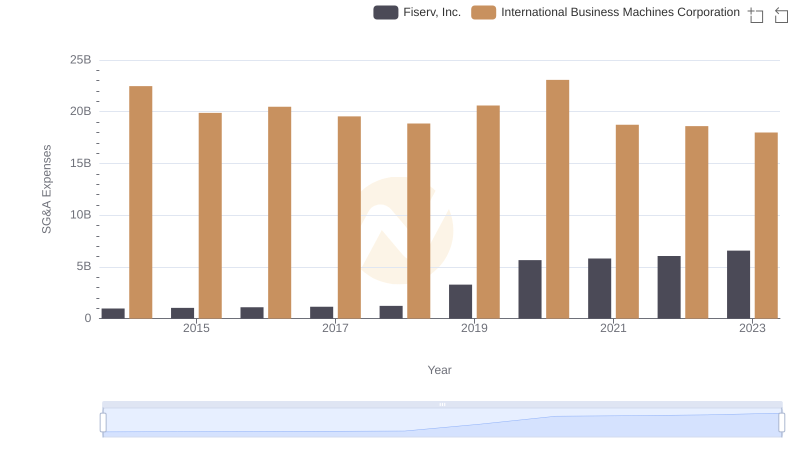
Comparing SG&A Expenses: International Business Machines Corporation vs Fiserv, Inc. Trends and Insights
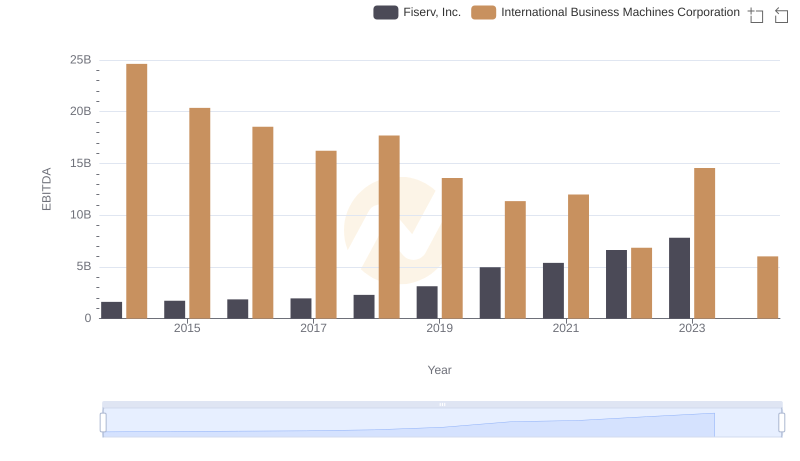
International Business Machines Corporation vs Fiserv, Inc.: In-Depth EBITDA Performance Comparison