| __timestamp | Eaton Corporation plc | Ryanair Holdings plc |
|---|---|---|
| Wednesday, January 1, 2014 | 15646000000 | 3838100000 |
| Thursday, January 1, 2015 | 14292000000 | 3999600000 |
| Friday, January 1, 2016 | 13400000000 | 4355900000 |
| Sunday, January 1, 2017 | 13756000000 | 4294000000 |
| Monday, January 1, 2018 | 14511000000 | 4512300000 |
| Tuesday, January 1, 2019 | 14338000000 | 5492800000 |
| Wednesday, January 1, 2020 | 12408000000 | 6039900000 |
| Friday, January 1, 2021 | 13293000000 | 1702700000 |
| Saturday, January 1, 2022 | 13865000000 | 4009800000 |
| Sunday, January 1, 2023 | 14763000000 | 7735000000 |
| Monday, January 1, 2024 | 15375000000 | 9566400000 |
Unleashing the power of data
In the ever-evolving landscape of global business, understanding the cost of revenue is crucial for evaluating a company's financial health. This analysis delves into the cost of revenue trends for Eaton Corporation plc and Ryanair Holdings plc from 2014 to 2023.
Eaton Corporation, a leader in power management, consistently maintained a higher cost of revenue compared to Ryanair, with figures peaking in 2014 at approximately $15.6 billion. Despite fluctuations, Eaton's cost of revenue remained relatively stable, reflecting its robust operational strategies.
Conversely, Ryanair, Europe's largest airline, exhibited a more dynamic trend. Starting at around $3.8 billion in 2014, Ryanair's cost of revenue surged by over 100% to nearly $7.7 billion by 2023, highlighting its aggressive expansion and operational scaling.
Interestingly, 2024 data for Eaton is missing, suggesting potential reporting delays or strategic shifts. This comparative analysis underscores the diverse financial trajectories of these industry giants.
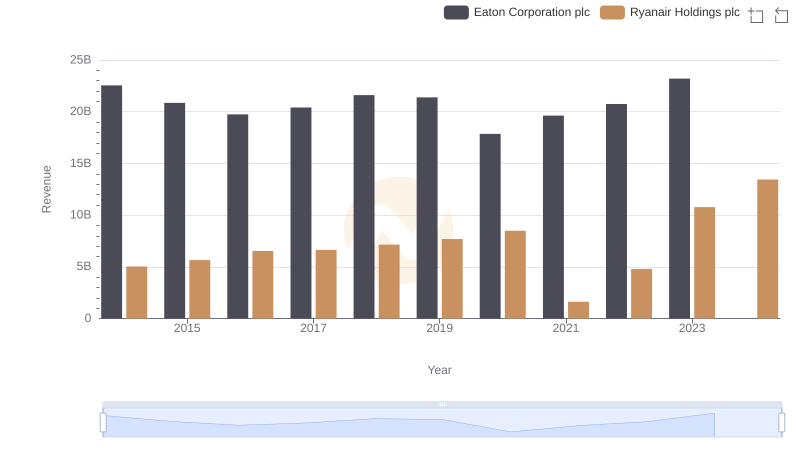
Breaking Down Revenue Trends: Eaton Corporation plc vs Ryanair Holdings plc
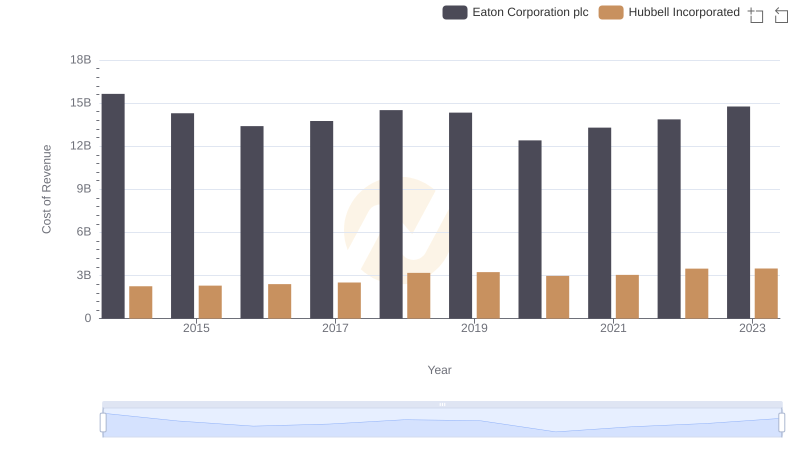
Eaton Corporation plc vs Hubbell Incorporated: Efficiency in Cost of Revenue Explored
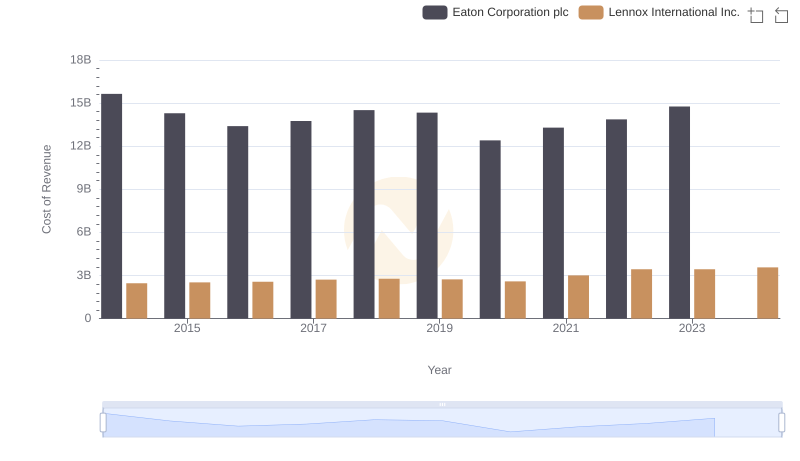
Analyzing Cost of Revenue: Eaton Corporation plc and Lennox International Inc.
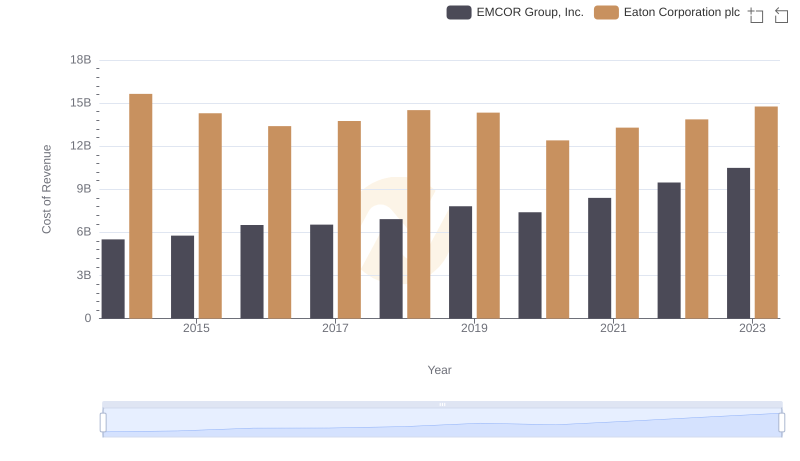
Cost of Revenue: Key Insights for Eaton Corporation plc and EMCOR Group, Inc.
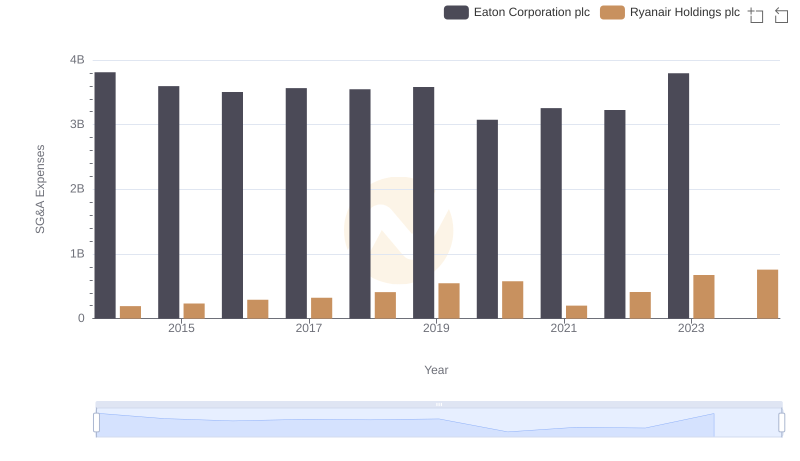
Operational Costs Compared: SG&A Analysis of Eaton Corporation plc and Ryanair Holdings plc
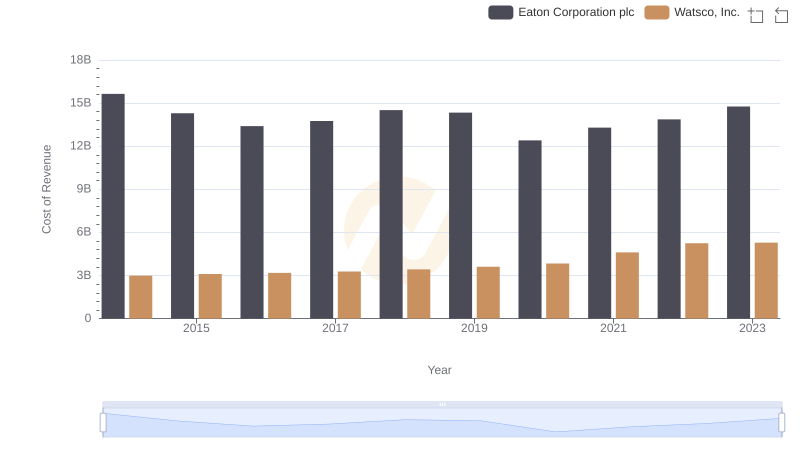
Cost of Revenue Comparison: Eaton Corporation plc vs Watsco, Inc.

Eaton Corporation plc vs AerCap Holdings N.V.: Efficiency in Cost of Revenue Explored
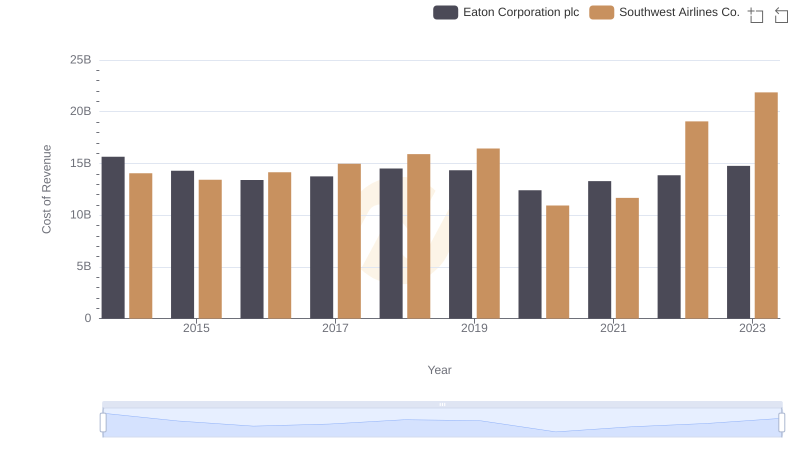
Analyzing Cost of Revenue: Eaton Corporation plc and Southwest Airlines Co.