| __timestamp | Cisco Systems, Inc. | ServiceNow, Inc. |
|---|---|---|
| Wednesday, January 1, 2014 | 19373000000 | 248776000 |
| Thursday, January 1, 2015 | 19480000000 | 329413000 |
| Friday, January 1, 2016 | 18287000000 | 398682000 |
| Sunday, January 1, 2017 | 17781000000 | 499772000 |
| Monday, January 1, 2018 | 18724000000 | 622658000 |
| Tuesday, January 1, 2019 | 19238000000 | 796645000 |
| Wednesday, January 1, 2020 | 17618000000 | 987113000 |
| Friday, January 1, 2021 | 17924000000 | 1353000000 |
| Saturday, January 1, 2022 | 19309000000 | 1573000000 |
| Sunday, January 1, 2023 | 21245000000 | 1921000000 |
| Monday, January 1, 2024 | 18975000000 | 2287000000 |
Data in motion
In the ever-evolving tech industry, understanding the cost of revenue is crucial for evaluating a company's financial health. Cisco Systems, Inc., a stalwart in networking technology, and ServiceNow, Inc., a leader in cloud-based solutions, present an intriguing comparison. From 2014 to 2024, Cisco's cost of revenue has shown a steady trend, peaking in 2023 with a 10% increase from 2014. In contrast, ServiceNow's cost of revenue has skyrocketed, reflecting a staggering 819% growth over the same period. This dramatic rise underscores ServiceNow's rapid expansion and increasing operational scale. While Cisco's cost of revenue remains significantly higher, ServiceNow's growth trajectory highlights its aggressive market penetration. This analysis offers a window into the strategic financial maneuvers of two tech giants, each navigating the complexities of their respective markets.
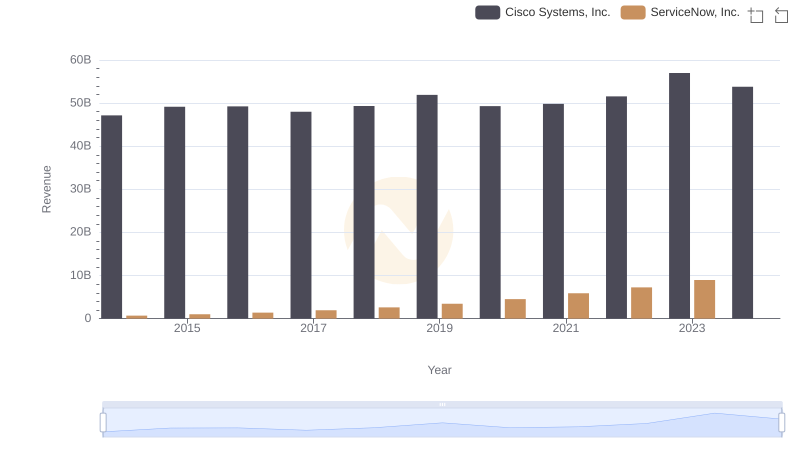
Cisco Systems, Inc. or ServiceNow, Inc.: Who Leads in Yearly Revenue?
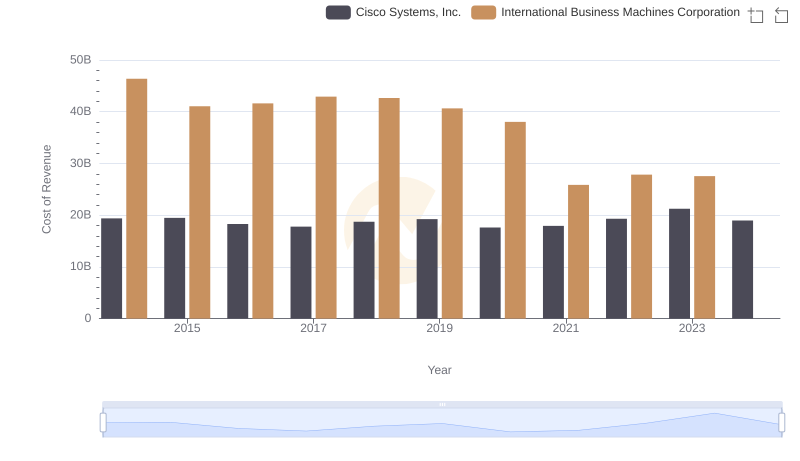
Cost Insights: Breaking Down Cisco Systems, Inc. and International Business Machines Corporation's Expenses
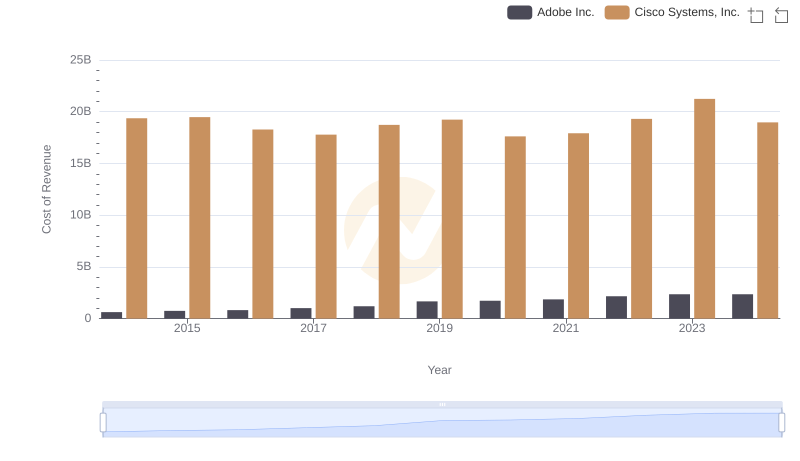
Comparing Cost of Revenue Efficiency: Cisco Systems, Inc. vs Adobe Inc.
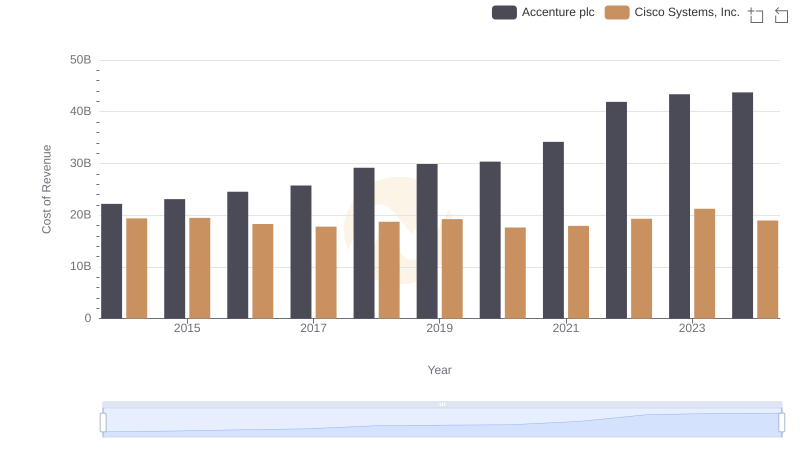
Analyzing Cost of Revenue: Cisco Systems, Inc. and Accenture plc
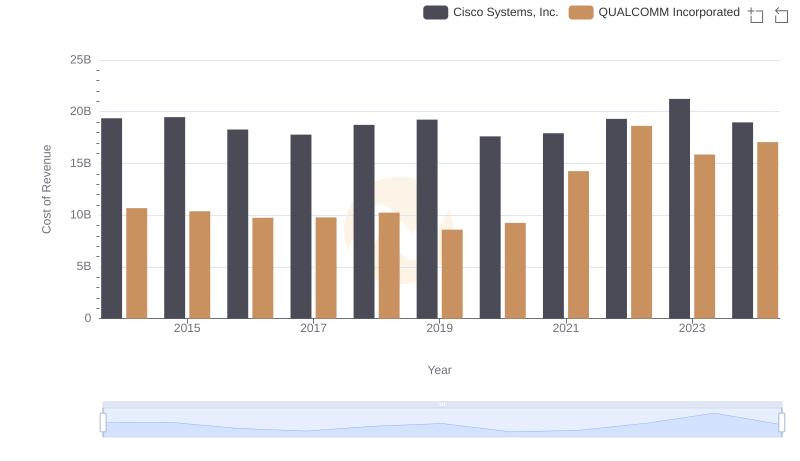
Cost of Revenue Comparison: Cisco Systems, Inc. vs QUALCOMM Incorporated
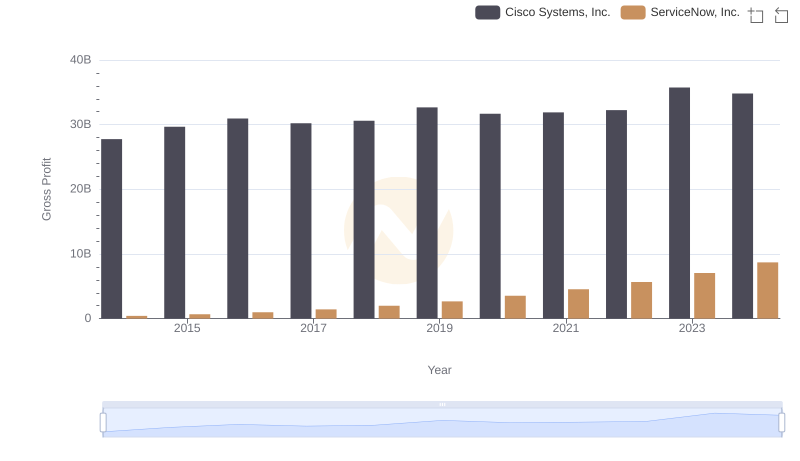
Gross Profit Trends Compared: Cisco Systems, Inc. vs ServiceNow, Inc.
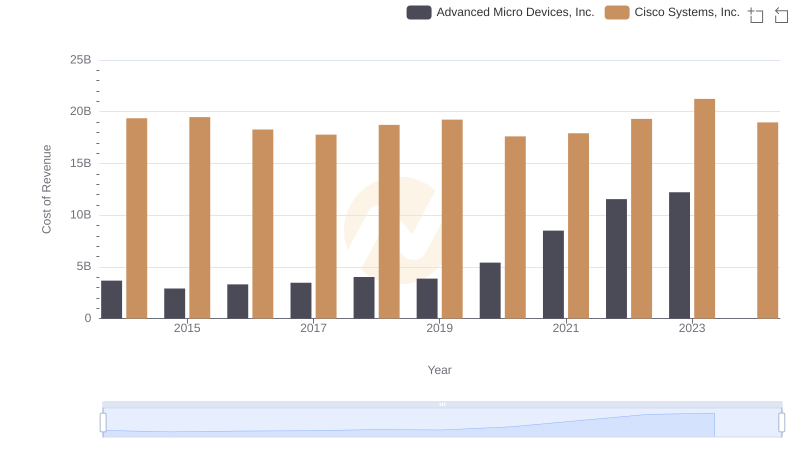
Cost of Revenue Trends: Cisco Systems, Inc. vs Advanced Micro Devices, Inc.
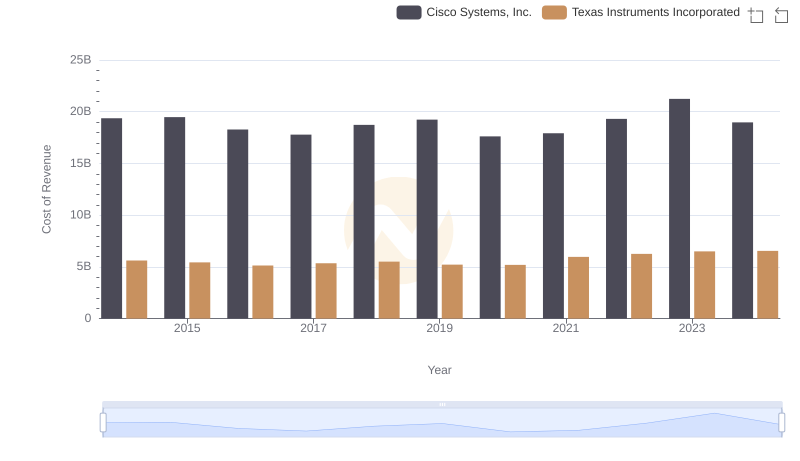
Cost of Revenue Trends: Cisco Systems, Inc. vs Texas Instruments Incorporated
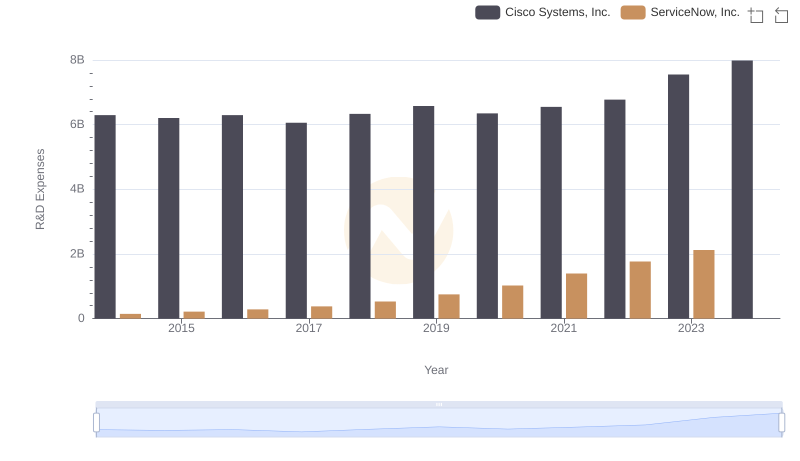
Who Prioritizes Innovation? R&D Spending Compared for Cisco Systems, Inc. and ServiceNow, Inc.
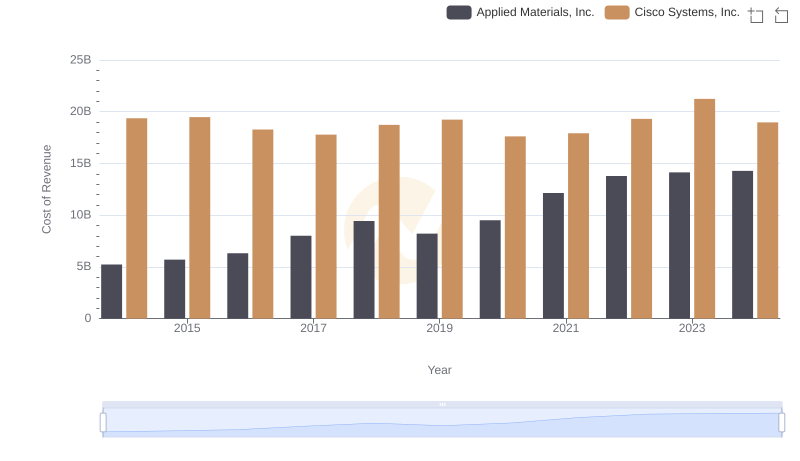
Cost of Revenue Trends: Cisco Systems, Inc. vs Applied Materials, Inc.
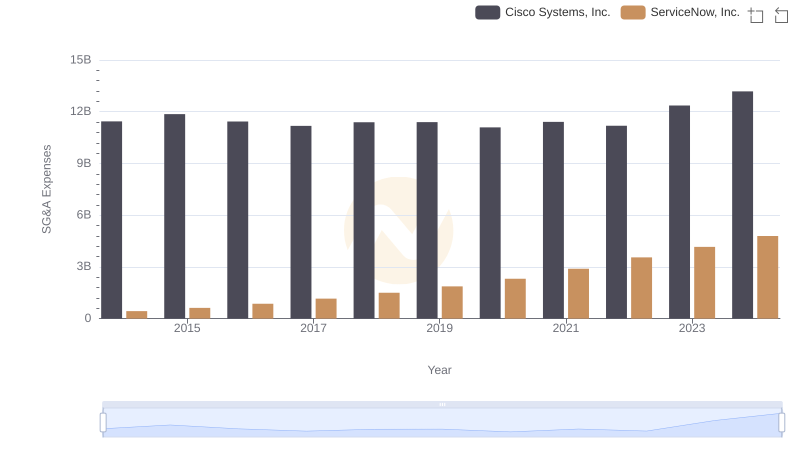
Cost Management Insights: SG&A Expenses for Cisco Systems, Inc. and ServiceNow, Inc.
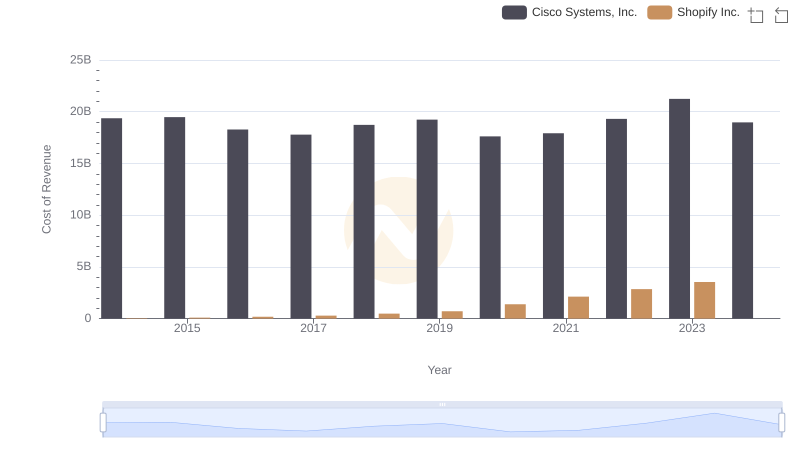
Cost of Revenue Comparison: Cisco Systems, Inc. vs Shopify Inc.