| __timestamp | Accenture plc | Cisco Systems, Inc. |
|---|---|---|
| Wednesday, January 1, 2014 | 22190212000 | 19373000000 |
| Thursday, January 1, 2015 | 23105185000 | 19480000000 |
| Friday, January 1, 2016 | 24520234000 | 18287000000 |
| Sunday, January 1, 2017 | 25734986000 | 17781000000 |
| Monday, January 1, 2018 | 29160515000 | 18724000000 |
| Tuesday, January 1, 2019 | 29900325000 | 19238000000 |
| Wednesday, January 1, 2020 | 30350881000 | 17618000000 |
| Friday, January 1, 2021 | 34169261000 | 17924000000 |
| Saturday, January 1, 2022 | 41892766000 | 19309000000 |
| Sunday, January 1, 2023 | 43380138000 | 21245000000 |
| Monday, January 1, 2024 | 43734147000 | 18975000000 |
Unleashing insights
In the ever-evolving landscape of technology and consulting, understanding the cost of revenue is crucial for assessing a company's financial health. Over the past decade, Accenture plc and Cisco Systems, Inc. have demonstrated contrasting trends in their cost of revenue. From 2014 to 2023, Accenture's cost of revenue surged by nearly 97%, reflecting its expanding global footprint and diversified service offerings. In contrast, Cisco's cost of revenue remained relatively stable, with a modest increase of around 10% over the same period, highlighting its focus on efficiency and innovation.
Accenture's significant growth, particularly from 2020 onwards, underscores its strategic investments in digital transformation and cloud services. Meanwhile, Cisco's steady trajectory suggests a balanced approach to managing operational costs while maintaining its leadership in networking solutions. As we look to the future, these trends offer valuable insights into the strategic priorities and market positioning of these industry giants.
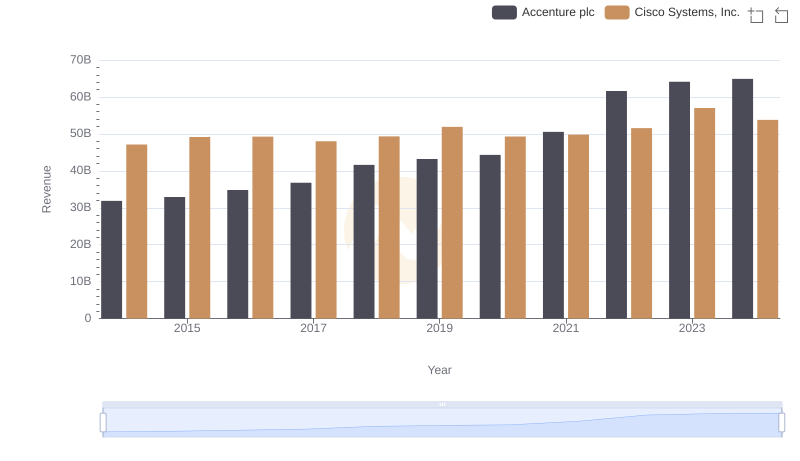
Cisco Systems, Inc. vs Accenture plc: Examining Key Revenue Metrics
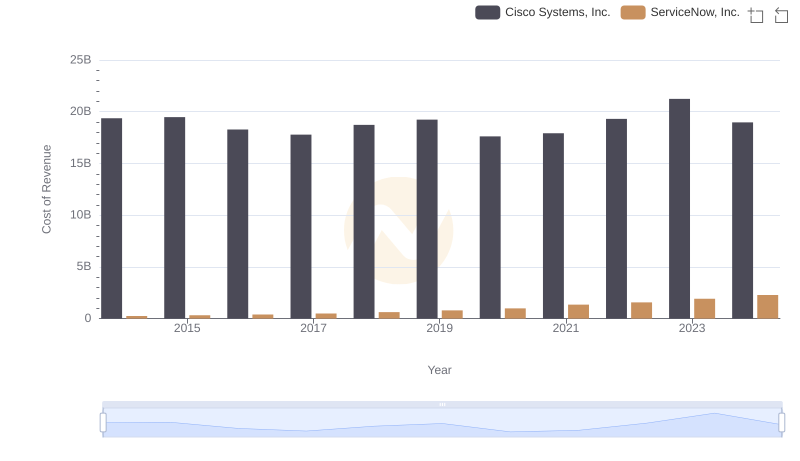
Analyzing Cost of Revenue: Cisco Systems, Inc. and ServiceNow, Inc.
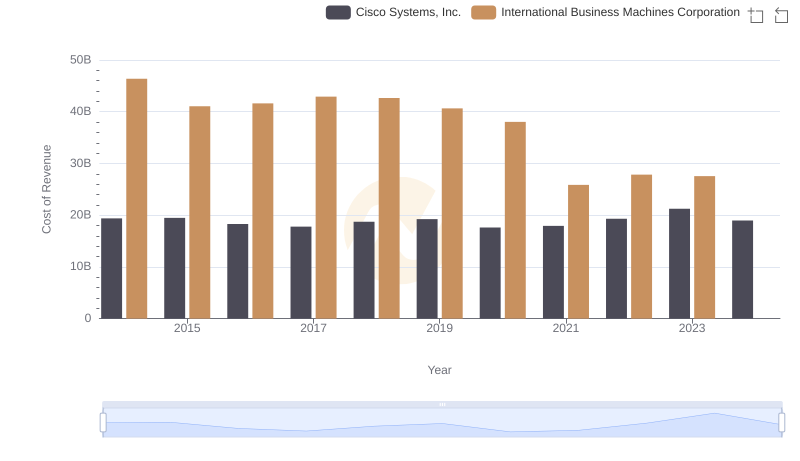
Cost Insights: Breaking Down Cisco Systems, Inc. and International Business Machines Corporation's Expenses
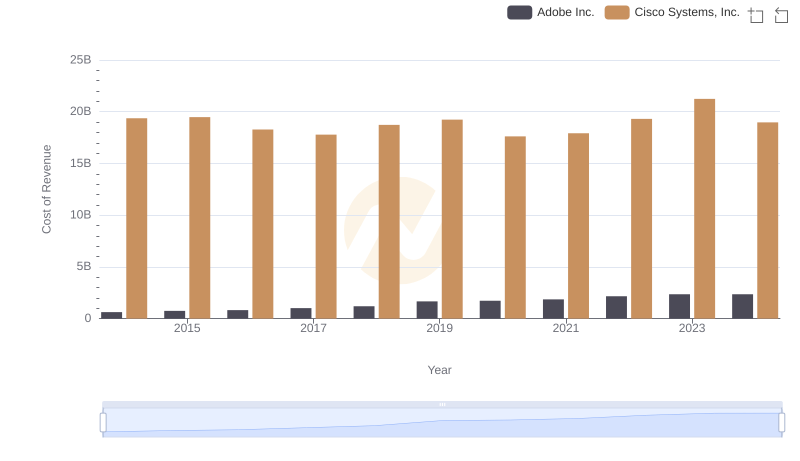
Comparing Cost of Revenue Efficiency: Cisco Systems, Inc. vs Adobe Inc.
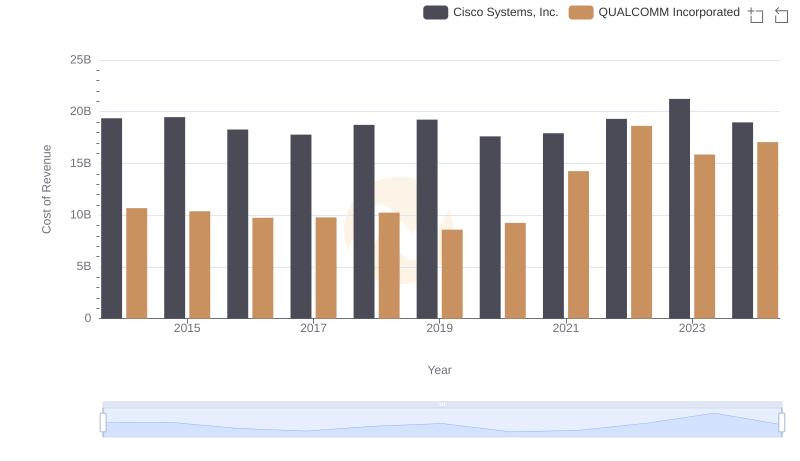
Cost of Revenue Comparison: Cisco Systems, Inc. vs QUALCOMM Incorporated
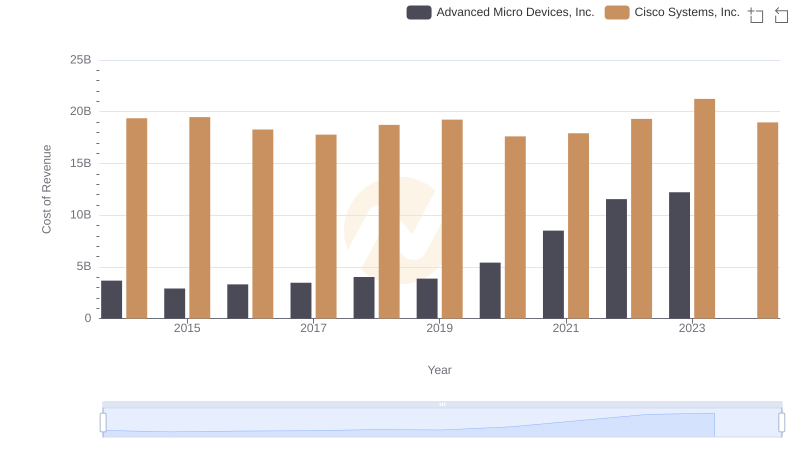
Cost of Revenue Trends: Cisco Systems, Inc. vs Advanced Micro Devices, Inc.
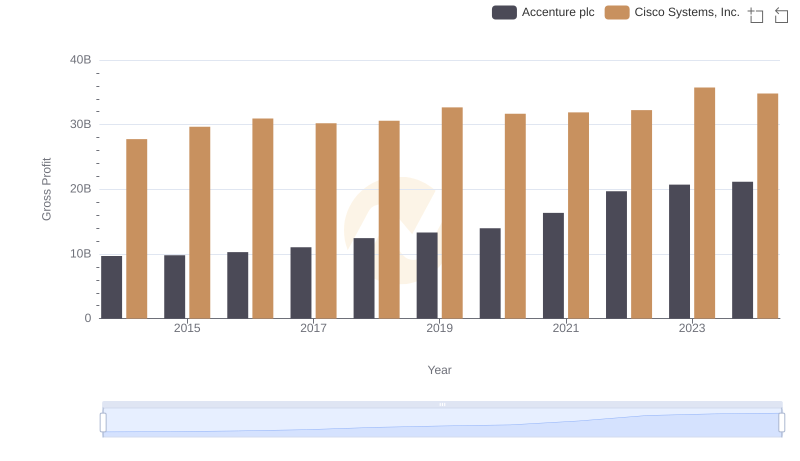
Cisco Systems, Inc. and Accenture plc: A Detailed Gross Profit Analysis
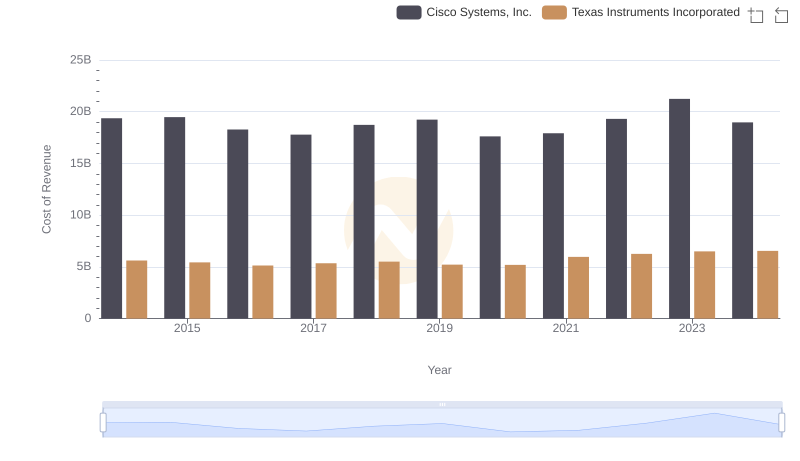
Cost of Revenue Trends: Cisco Systems, Inc. vs Texas Instruments Incorporated
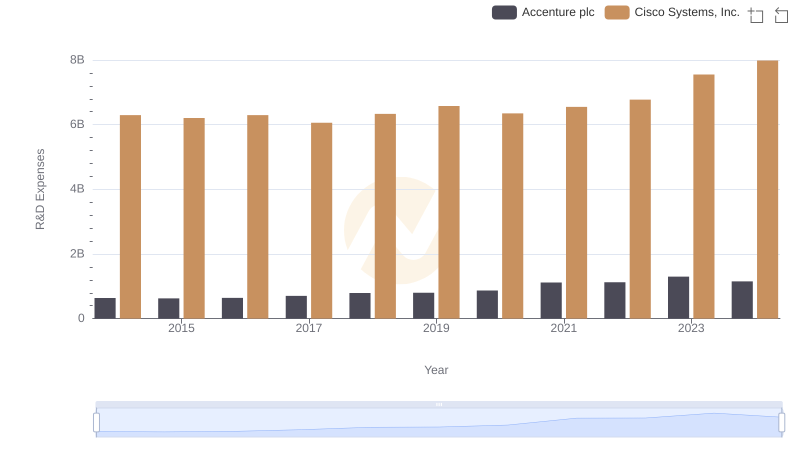
Cisco Systems, Inc. or Accenture plc: Who Invests More in Innovation?
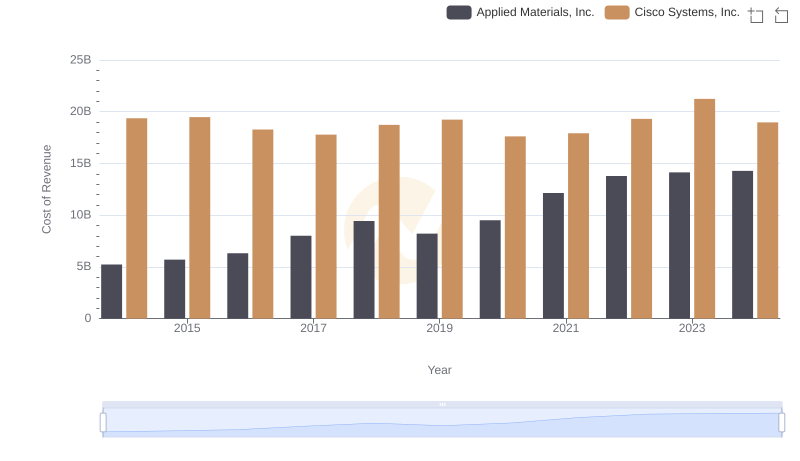
Cost of Revenue Trends: Cisco Systems, Inc. vs Applied Materials, Inc.
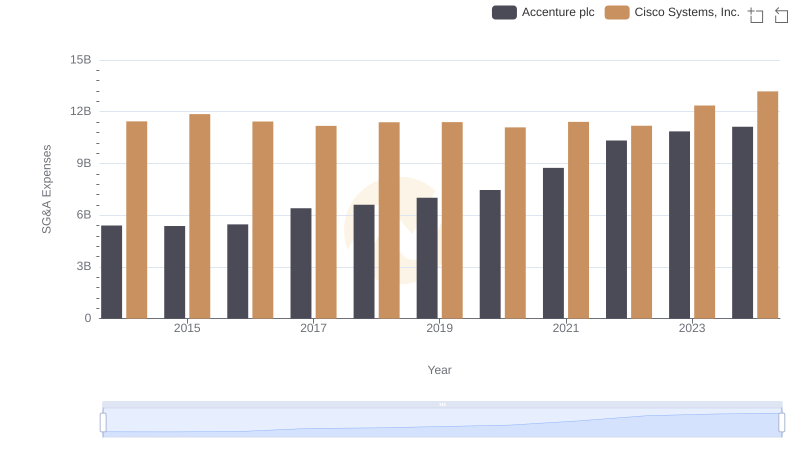
Cisco Systems, Inc. vs Accenture plc: SG&A Expense Trends
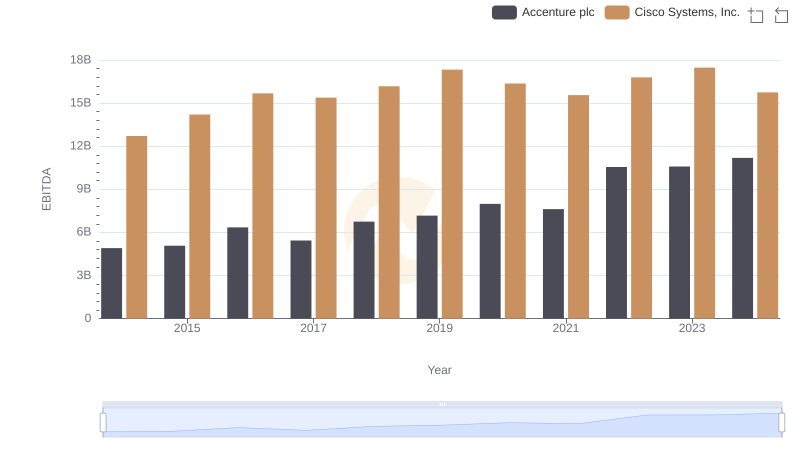
Cisco Systems, Inc. vs Accenture plc: In-Depth EBITDA Performance Comparison