| __timestamp | Cisco Systems, Inc. | QUALCOMM Incorporated |
|---|---|---|
| Wednesday, January 1, 2014 | 19373000000 | 10686000000 |
| Thursday, January 1, 2015 | 19480000000 | 10378000000 |
| Friday, January 1, 2016 | 18287000000 | 9749000000 |
| Sunday, January 1, 2017 | 17781000000 | 9792000000 |
| Monday, January 1, 2018 | 18724000000 | 10244000000 |
| Tuesday, January 1, 2019 | 19238000000 | 8599000000 |
| Wednesday, January 1, 2020 | 17618000000 | 9255000000 |
| Friday, January 1, 2021 | 17924000000 | 14262000000 |
| Saturday, January 1, 2022 | 19309000000 | 18635000000 |
| Sunday, January 1, 2023 | 21245000000 | 15869000000 |
| Monday, January 1, 2024 | 18975000000 | 17060000000 |
Igniting the spark of knowledge
In the ever-evolving tech industry, Cisco Systems, Inc. and QUALCOMM Incorporated have been pivotal players. Over the past decade, from 2014 to 2024, these companies have showcased intriguing trends in their cost of revenue. Cisco's cost of revenue has seen a steady increase, peaking in 2023 with a 10% rise from 2014. In contrast, QUALCOMM's cost of revenue fluctuated, with a notable 75% increase from 2019 to 2022, reflecting its dynamic market strategies.
Cisco's consistent growth highlights its robust operational efficiency, while QUALCOMM's variable costs underscore its adaptive approach in a competitive landscape. The data reveals that both companies have navigated economic challenges and opportunities, with Cisco maintaining a more stable trajectory and QUALCOMM demonstrating resilience through strategic pivots. This comparison offers valuable insights into the financial health and strategic directions of these tech titans.
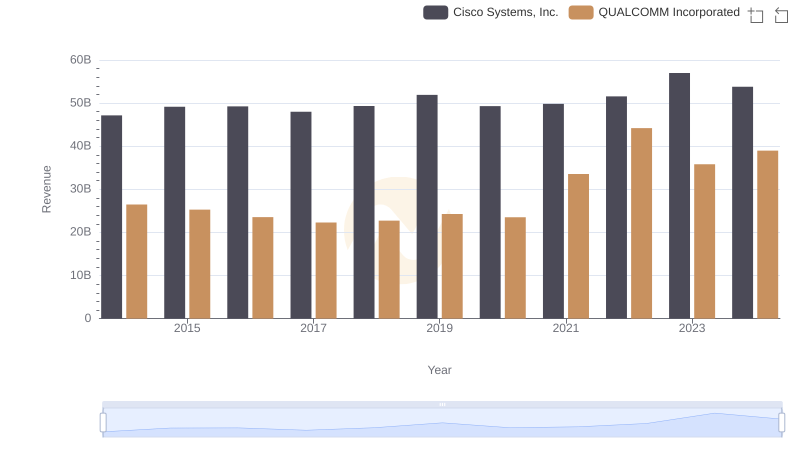
Cisco Systems, Inc. vs QUALCOMM Incorporated: Annual Revenue Growth Compared
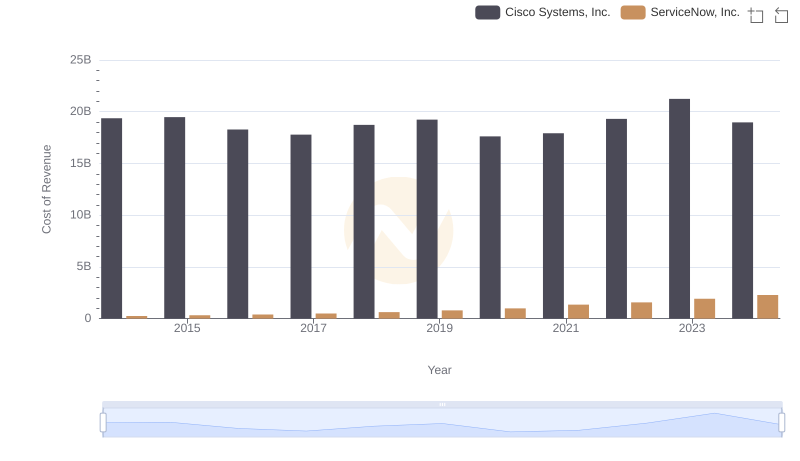
Analyzing Cost of Revenue: Cisco Systems, Inc. and ServiceNow, Inc.
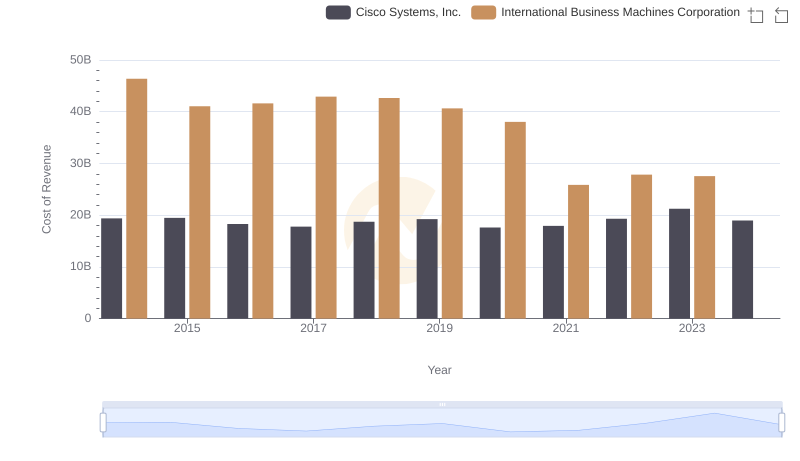
Cost Insights: Breaking Down Cisco Systems, Inc. and International Business Machines Corporation's Expenses
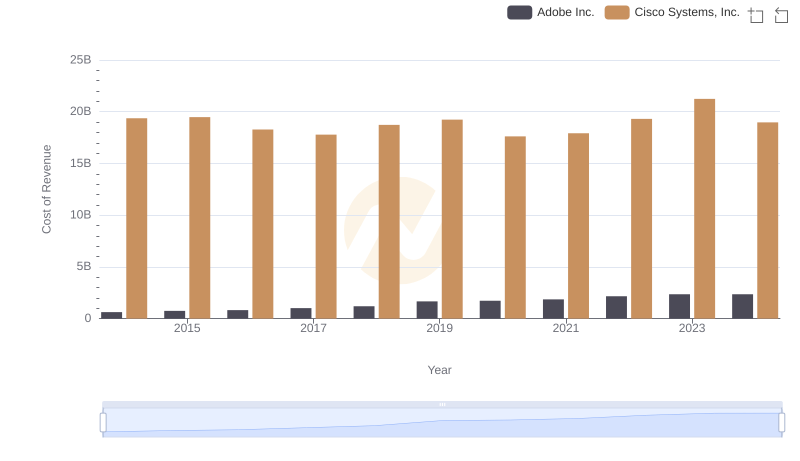
Comparing Cost of Revenue Efficiency: Cisco Systems, Inc. vs Adobe Inc.
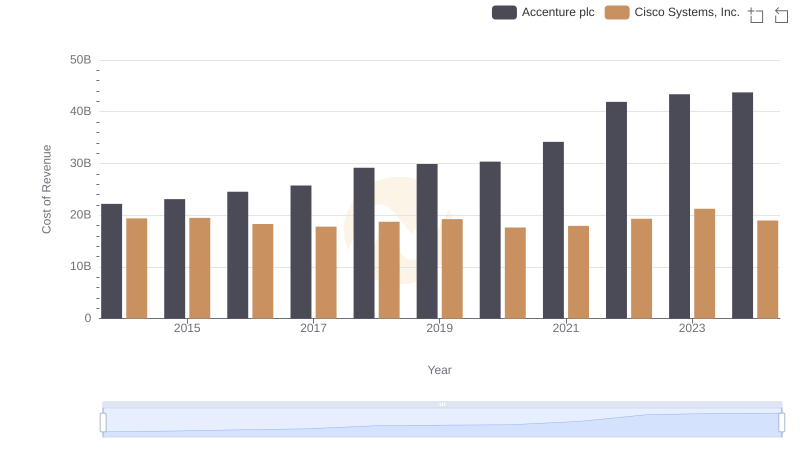
Analyzing Cost of Revenue: Cisco Systems, Inc. and Accenture plc
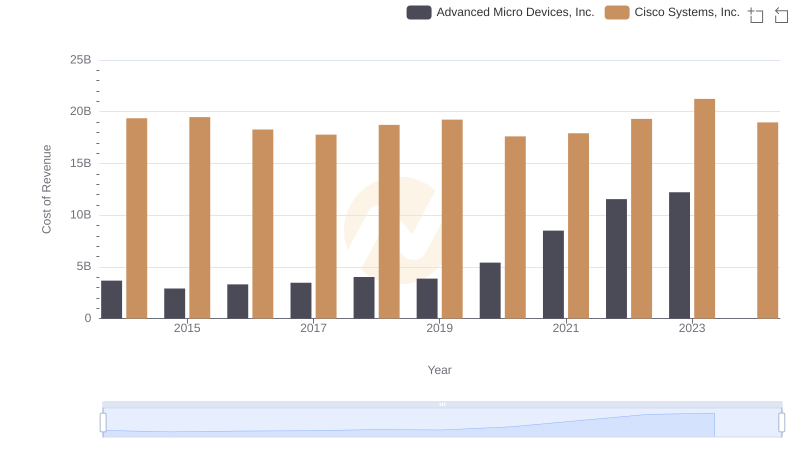
Cost of Revenue Trends: Cisco Systems, Inc. vs Advanced Micro Devices, Inc.
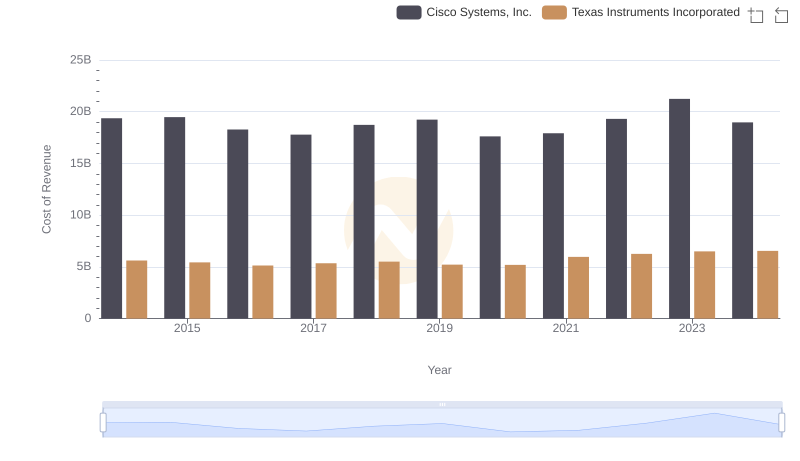
Cost of Revenue Trends: Cisco Systems, Inc. vs Texas Instruments Incorporated
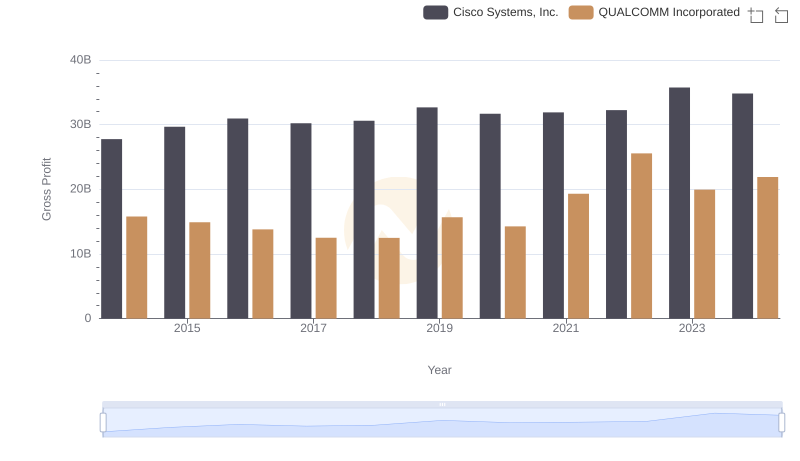
Who Generates Higher Gross Profit? Cisco Systems, Inc. or QUALCOMM Incorporated
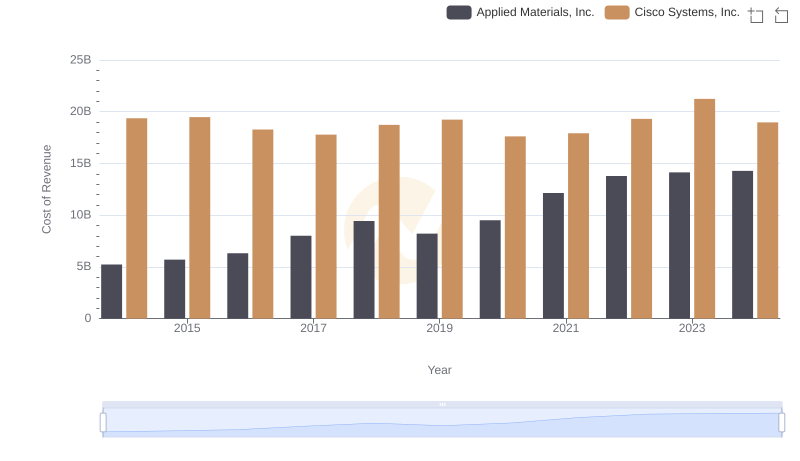
Cost of Revenue Trends: Cisco Systems, Inc. vs Applied Materials, Inc.
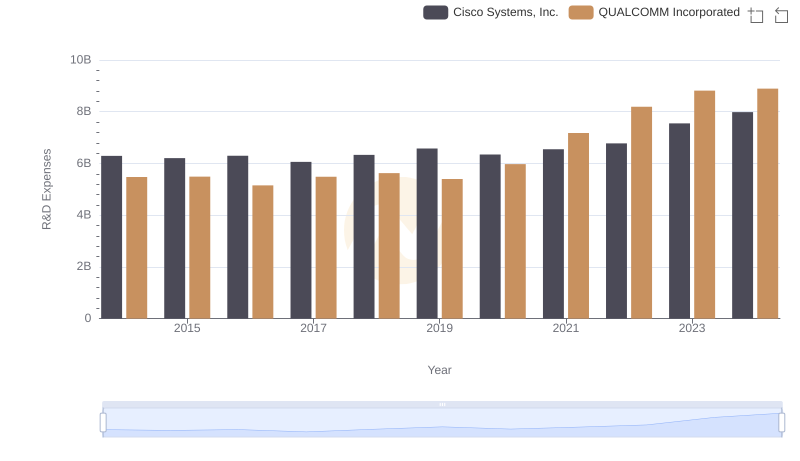
Research and Development Investment: Cisco Systems, Inc. vs QUALCOMM Incorporated
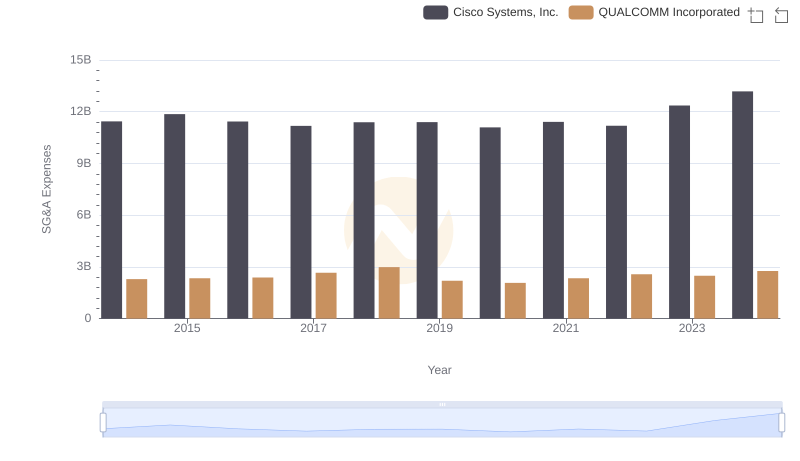
SG&A Efficiency Analysis: Comparing Cisco Systems, Inc. and QUALCOMM Incorporated
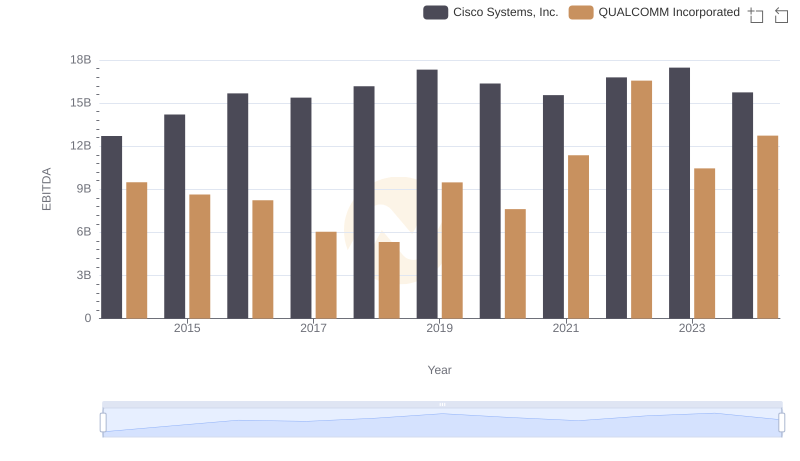
Cisco Systems, Inc. and QUALCOMM Incorporated: A Detailed Examination of EBITDA Performance